Comparing Leagues and the Contribution of Chance
League Comparison
After Alyssa Thompson’s move to Chelsea, there was a decent amount of discussion about whether she was taking a step up, not just in terms of her team, but in terms of the league. Even this isn’t particularly clear, as Chelsea play in the WSL and the Champions League. But I actually had been working for the past couple months on a League Comparison app, so this seemed like a good occasion to introduce it. The app can be found at:
https://goosecat.shinyapps.io/League_Comparison/
A few notes about it: The app compares both goals and xG for the NWSL, Liga F, and the WSL. The datasets are from the 2024 NWSL season and the 2024-2025 WSL and Liga F season, i.e. the last complete season for all leagues. In the future, I’d like to expand this to include the French and German leagues, as well as multiple seasons. It’s also probably best on a computer, rather than mobile.
Observations
Pretty clearly, the NWSL is the most compact of the three leagues. It’s almost comical how far removed Barcelona and Real Madrid are from the rest of Liga F (if you hover over a point in the boxplot, you can see which team it is). One of the things that stood out to me, however, was how dramatic of a shift there was for the NWSL when you toggle between xG per 90 and Goals per 90 (these are all on a per 90 because each league plays a different number of games). While the WSL and Liga F remain pretty consistent, the NWSL has dramatically lower goals, especially looking at the bottom of the plots. For Goals per 90, the NWSL actually has the worst mark of any team in all three leagues: the Houston Dash at 0.73. But when we switch to xG per 90, that same last-place Houston Dash team is better than 6 Spanish teams (37.5% of Liga F) and 3 English teams (25% of the WSL). This got me wondering if the NWSL just has particularly bad finishing or particularly good goalkeeping.
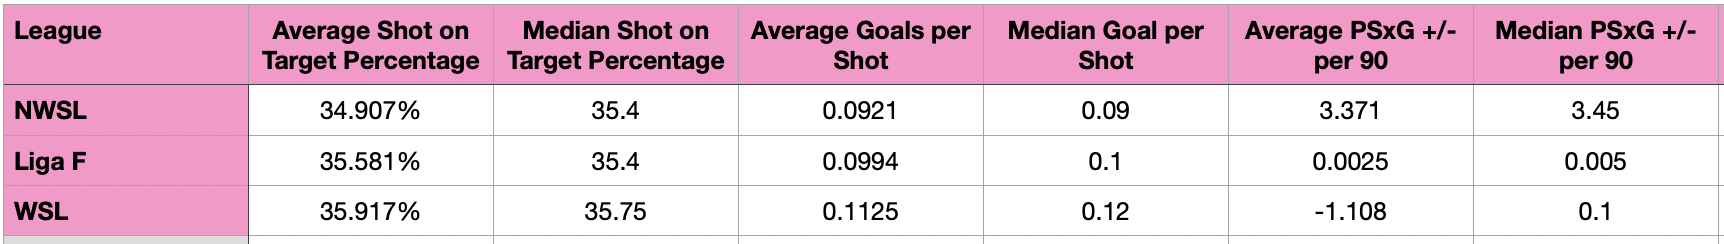
It turns out it’s a little of both, as we can see from the table above. The NWSL has the lowest Shot on Target Percentage, but not by a lot, and the median Shot on Target Percentages are actually very similar between all three leagues. The NWSL also has a lower average and median Goals per Shot, but again, it is pretty close. However, there is an enormous difference between the NWSL and the other two leagues in PSxG +/-, however. It doesn’t surprise me to see that NWSL goalkeepers are better than the rest, but I was surprised to see that this even applies to big clubs. Hannah Hampton was just crowned the best goalkeeper in world, yet her PSxG +/- was only 2.1, or +.09 per 90. There are 12 goalkeepers in the NWSL with a better mark than that (none of them were on Angel City). At Barcelona, Cata Coll has a -1.8 PSxG +/-, or -.08 per 90. She’s at something of a disadvantage in that she only faces 1.4 Shots on Target per game, so any goal she concedes is going to count heavily against her, but still. To me, this higher quality of goalkeeping more than makes up for the slightly lower finishing.
The other tools on the app are QQ Plots to directly compare one league to another and visually represents which league scores more. The player comparison tool allows you to choose any player from these leagues (in the years included), and predicts how their performance would translate in another league. It does this by using the formula for the trendline on the QQ Plots and substituting in the chosen player’s actual goal total. So for instance, with Alyssa Thompson going to the WSL, her 5 goals last year would translate to 6.757 goals in England. Please play around with it, and let me know what you think.
Chance
There is an aspect of American sports fandom, I feel, that embraces the chaotic nature of the parity of most North American leagues. These fans like that an underdog might beat a top team in any given game. "They’ve got a chance," or some variation, is what I usually hear. And I think that this is especially pronounced in soccer, as a single goal can make such a big difference, and it's not uncommon to see a team that was outplayed manage a late equalizer or winner.
So I was really intrigued when I came across a section in Soccer Analytics in which the author, Clive Beggs, quantified the contribution of chance. As an aside, this is a great book for anyone that want’s to learn more about soccer analytics, especially if you’re new to coding. If you want to skip the math, feel free to go straight to the Results.
First, Beggs calculated the observed points average and population variance in the observed league (in his example, that’s the Premier League). Then he specified the probabilities of a home win, away win, and a draw.
Then, he calculated the expected average points value and expected points variance for all teams if the league was completely random, using the following equations:
Expected Average Points Total per Team: exP <- (m/2)*(3-pD)
Expected Points Variance: exVar <- (m/2)*(9-(7*pD)-(((3*pH)+pD)2) - (((3*pA)+pD)2))
where m = number of matches played, pD = probability of a draw, pH = probability of a home win, and pA is a probability of an away win.
Having calculated these values, we can divide the expected variance by the actual league variance to determine the percentage of the variance that is due to chance. I applied this to the same seasons I used for the app: NWSL (2024), WSL (2025), and Liga F (2025). In Beggs' example, he was calculating the 2020-2021 Premier League Season, and determined that 23.41% of a team's points were due to chance.
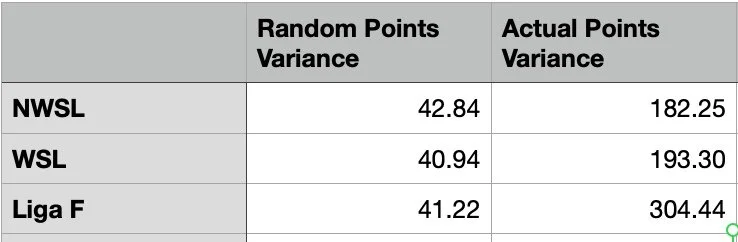
The chart above shows the computed variance levels if everything was completely random and then the way that things actually were. Liga F is so much larger in Actual Variance because Barcelona is so much better than everyone else, but also because they have the most teams (16), therefore more games and more points available.
Results
So for my examples, I found chance to be responsible for 23.51% of points in the NWSL, 21.17% in the WSL, and only 13.54% in Liga F. In other word’s, of Bareclons’s 84 points, 11.37 are attributable to chance, while for Angel City’s 27 points (I’m not including the point deduction penalty here), 6.35 points are attributable to chance. It makes sense to me that the more parity a league has, the more chance plays a role. But especially in the NWSL, there is a narrative that any team can beat any other, and you never know what's going to happen. 23.51% is definitely an amount to consider, but that's also not the coin toss that some people make it out to be. Every team has a shot, but good teams still win more.
Another application of this would be to compare multiple years of the same league to determine trends, or perhaps add context to a particularly close title race. For my examples, I got my win probabilities from American Soccer Analysis, Opta, and Besoccer. Not all of these are up to date, and if I were to pursue this further, that would be my next step.
The rest of the data was gathered from FB Ref.
Angel City’s next game is away at Racing Louisville on Saturday September 27th at 4:30p Pacific. It will be available on Ion.