ACFC Central Midfielders 2025
This is the position group that I look forward to the most, because I love central midfielders. I am a strong believer that controlling the middle of the pitch goes a long way to winning games. For our purposes, I am looking at players in either the No 6 or No 8 roles, as I think that it doesn’t make sense to compare Central Attacking Midfielders to the same standards.
As with all of these positional group articles, I am going in order of minutes played and I am not including players that did not finish the season on the team. Without that last part, the leader would have been Alanna Kennedy, who had 1,347 minutes, although 360 of those were as a defender. The actual leader, Madison Hammond, only had 9 starts, 927 minutes, and has departed the team in the offseason. I’m not sure that there is a better illustration on the upheaval that Angel City has faced in this position.
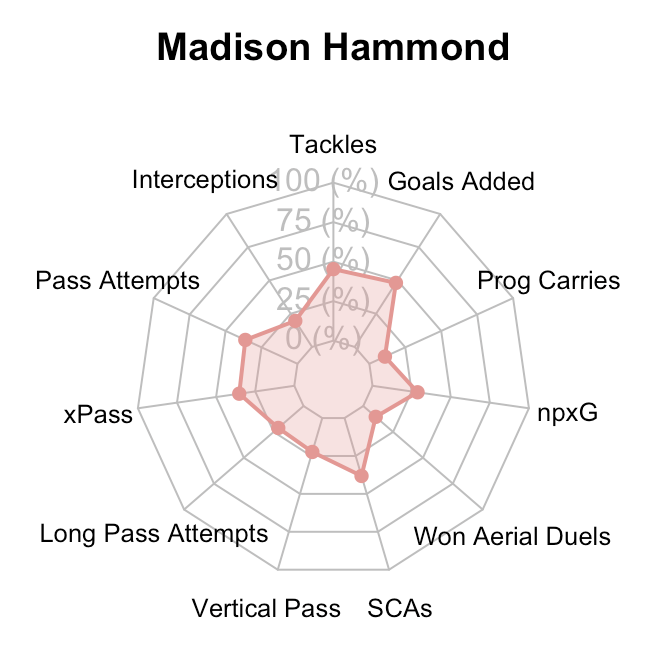
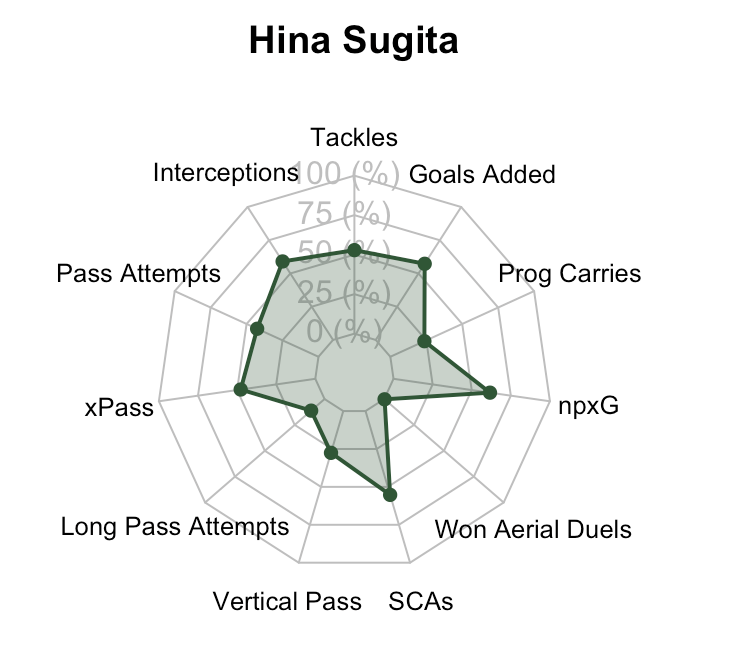
The radar plots consist of the following categories for the following reasons:
Tackles - Can the player win the ball back?
Interceptions - How is the player’s positioning and reading of the play?
Pass Attempts - How involved is the player in the passing game?
xPass Score - How accurate were the player’s passes, and did they exceed expectations?
Long Pass Attempts - What is the player’s passing range and vision?
Vertical Pass Distance - How well does the player get the ball downfield
Shot Creating Actions - How much general offense is contributed? For a CM or DM, this is usually more important than xA, xAG, or Key Passes, which can be more rare.
Won Aerial Duels - What is the player’s presence in the air?
npxG - How much value from shots is created?
Progressive Carries - Can the player advance the ball themselves?
Goals Added - ASA’s complete score of player value
As I said above, Hammond had only 9 starts, but did play in 21 matches, and had 927 minutes. This was down from both of the previous seasons. Hammond was tied for second on the team in substitute appearances with Moriya. She also had five occasions where she was an unused substitute, including four of the final five games. The lone exception to that was only two minutes. It does seem pretty clear that once Martin and Sugita were brought in, Hammond was no longer in Straus’ plans.
Passing
To me, passing is the most important skill a midfielder can have, and while they have many other responsibilities, I think that nothing is more important than passing. It is also probably Hammond’s greatest strength. In fact, among all CMs and DMs, Hammond had the third highest Total Completion Percentage, and the highest among players with at least 800 minutes.
Her 40.58 Pass Attempts per 90 is only in the 51st percentile however. The unsupervised clustering model that I ran classified Hammond as a deep-lying playmaker, which I think is a fair assessment. But compared to others, like Kenza Dali, Hammond was never in the role of pulling the strings for the whole team. Obviously that is reflected by her not being a consistent starter. Hammond’s xPass score of 11.02 is pretty good (65th percentile). When converted to a per 100 minutes (ASA’s choice), that becomes 2.65 (75th percentile). I would characterize her as a very tidy passer, who is above average in her accuracy, but errs slightly on the side of making safe passes.
The metrics show Hammond’s passing as not particularly valuable, although it would be wrong to say that it is lacking in value. Her 3.30 Long Pass Attempts was only in the 34th percentile, although her 61.8% Completion rate on Long Passes was the 6th highest in the league. In essence, she didn’t spread the ball around too much, but she does have that kind of pass in her locker. Her Vertical Passing score was 2.64 yards ( 34th percentile), while she averaged 4.76 Progressive Passes per 90 (65th percent). The definitive measure here might be her g+ score for passing, which is -0.26 (16th percentile).
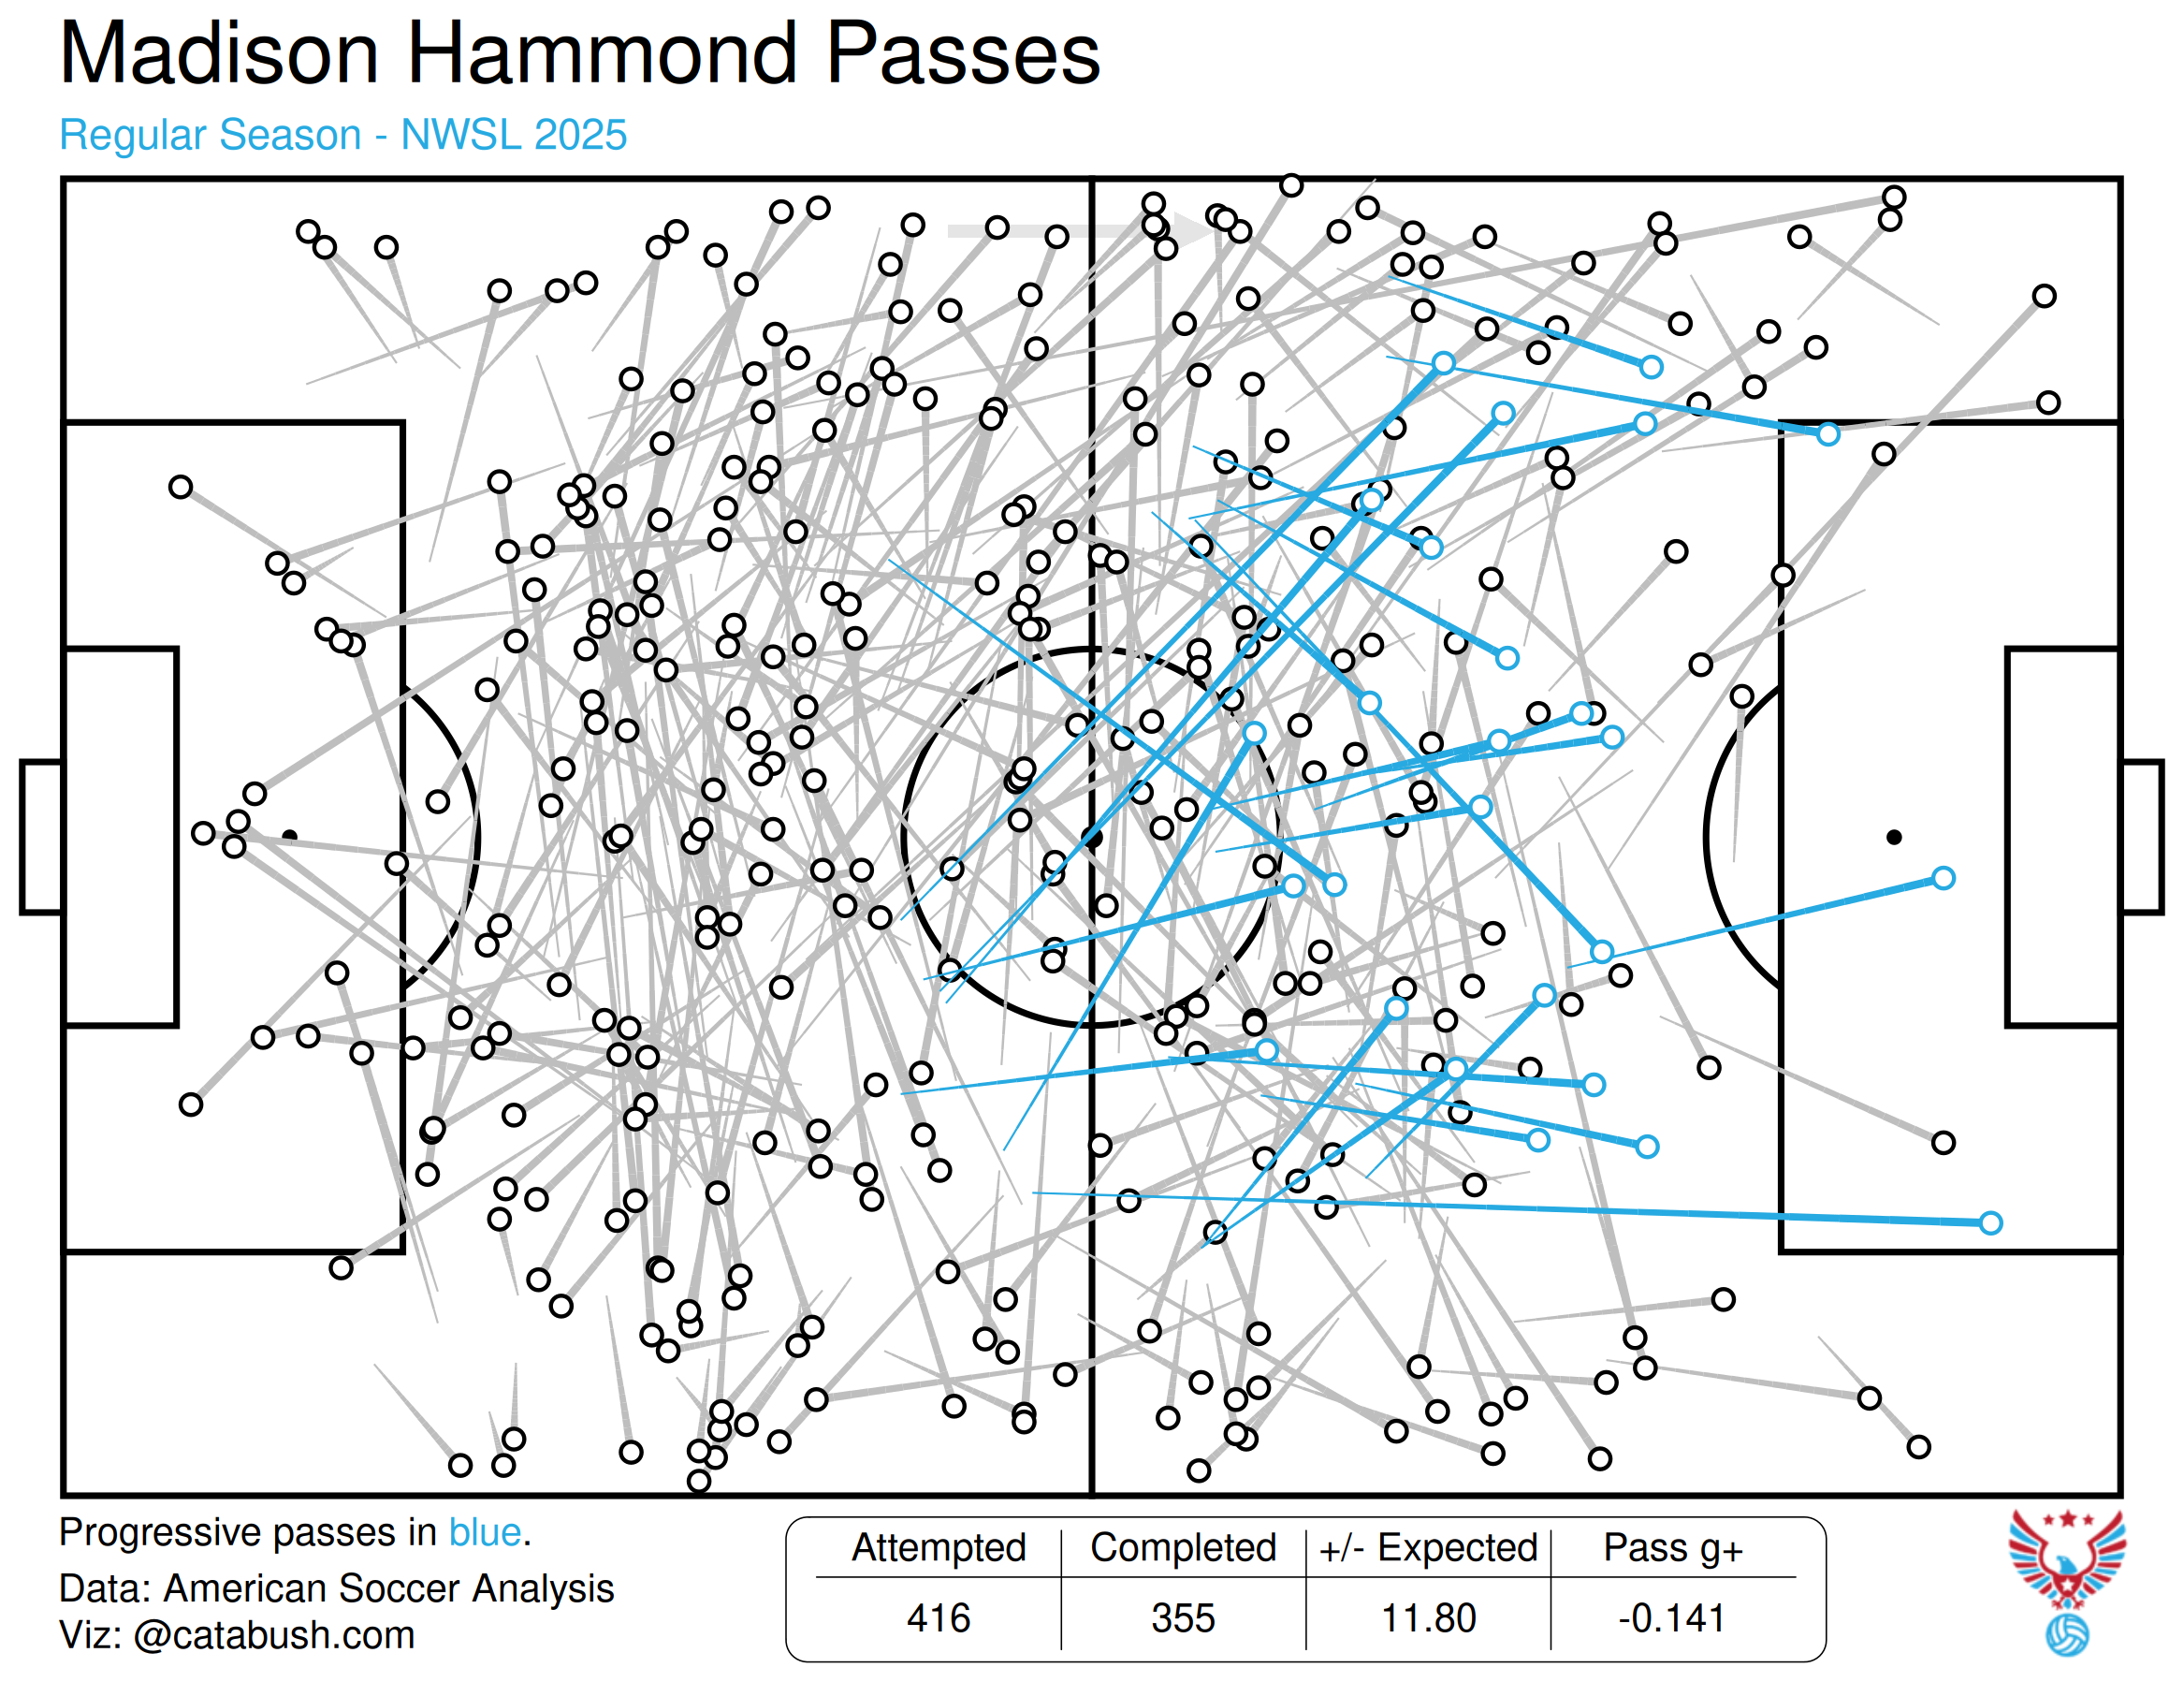
There does seem to be a discrepancy here. In a nutshell, all of the previous stats can be distilled into this: Hammond is good at passing, but her passing doesn’t add to goals for her team. I think that the chart above helps explain this. A lot of her passing is out wide, and she has a decent amount of backward passes that I think more or less negate her progressive passes. A ball out wide isn’t going to register in the models as getting closer to goal (as technically it’s not). It’s also worth noting that Hammond is operating from a deeper position than some other CMs or even DMs. She averaged 3.79 Passes Into the Attacking Third per 90 (69th percentile), but only 0.29 Passes Into the Penalty Area (18th percentile), and we can see in the Pass Chart above that even many of the passes into the penalty area were only just on the edges.
My final evaluation is that Hammond is not a sloppy passer, but she also doesn’t take a lot of risks. I think that she has the skill and technique. Her next step is identifying and taking the line-breaking passes that are going to create chances, not just maintain possession (and also possibly being given the license to do so).
Offensive Contribution
Focusing next on goal contributions, in which Hammond unsurprisingly has very little, given her deep position. She had 0 Goals and 0 Assists, but from 0.9 npxG (61st percentile), 0.3 xAG (16th percentile), and 0.5 xA (42nd percentile). I thought that perhaps it would be more fitting to only compare Hammond to other Deep Lying Playmakers, but this comparison doesn’t actually flatter her, as many players clustered here do have good offensive numbers, such as Sam Coffey and Julia Grosso. Amongst only this cluster, Hammond is in the 78th percentile in npxG, but is 7th percentile for xAG and 21st percentile for xA.
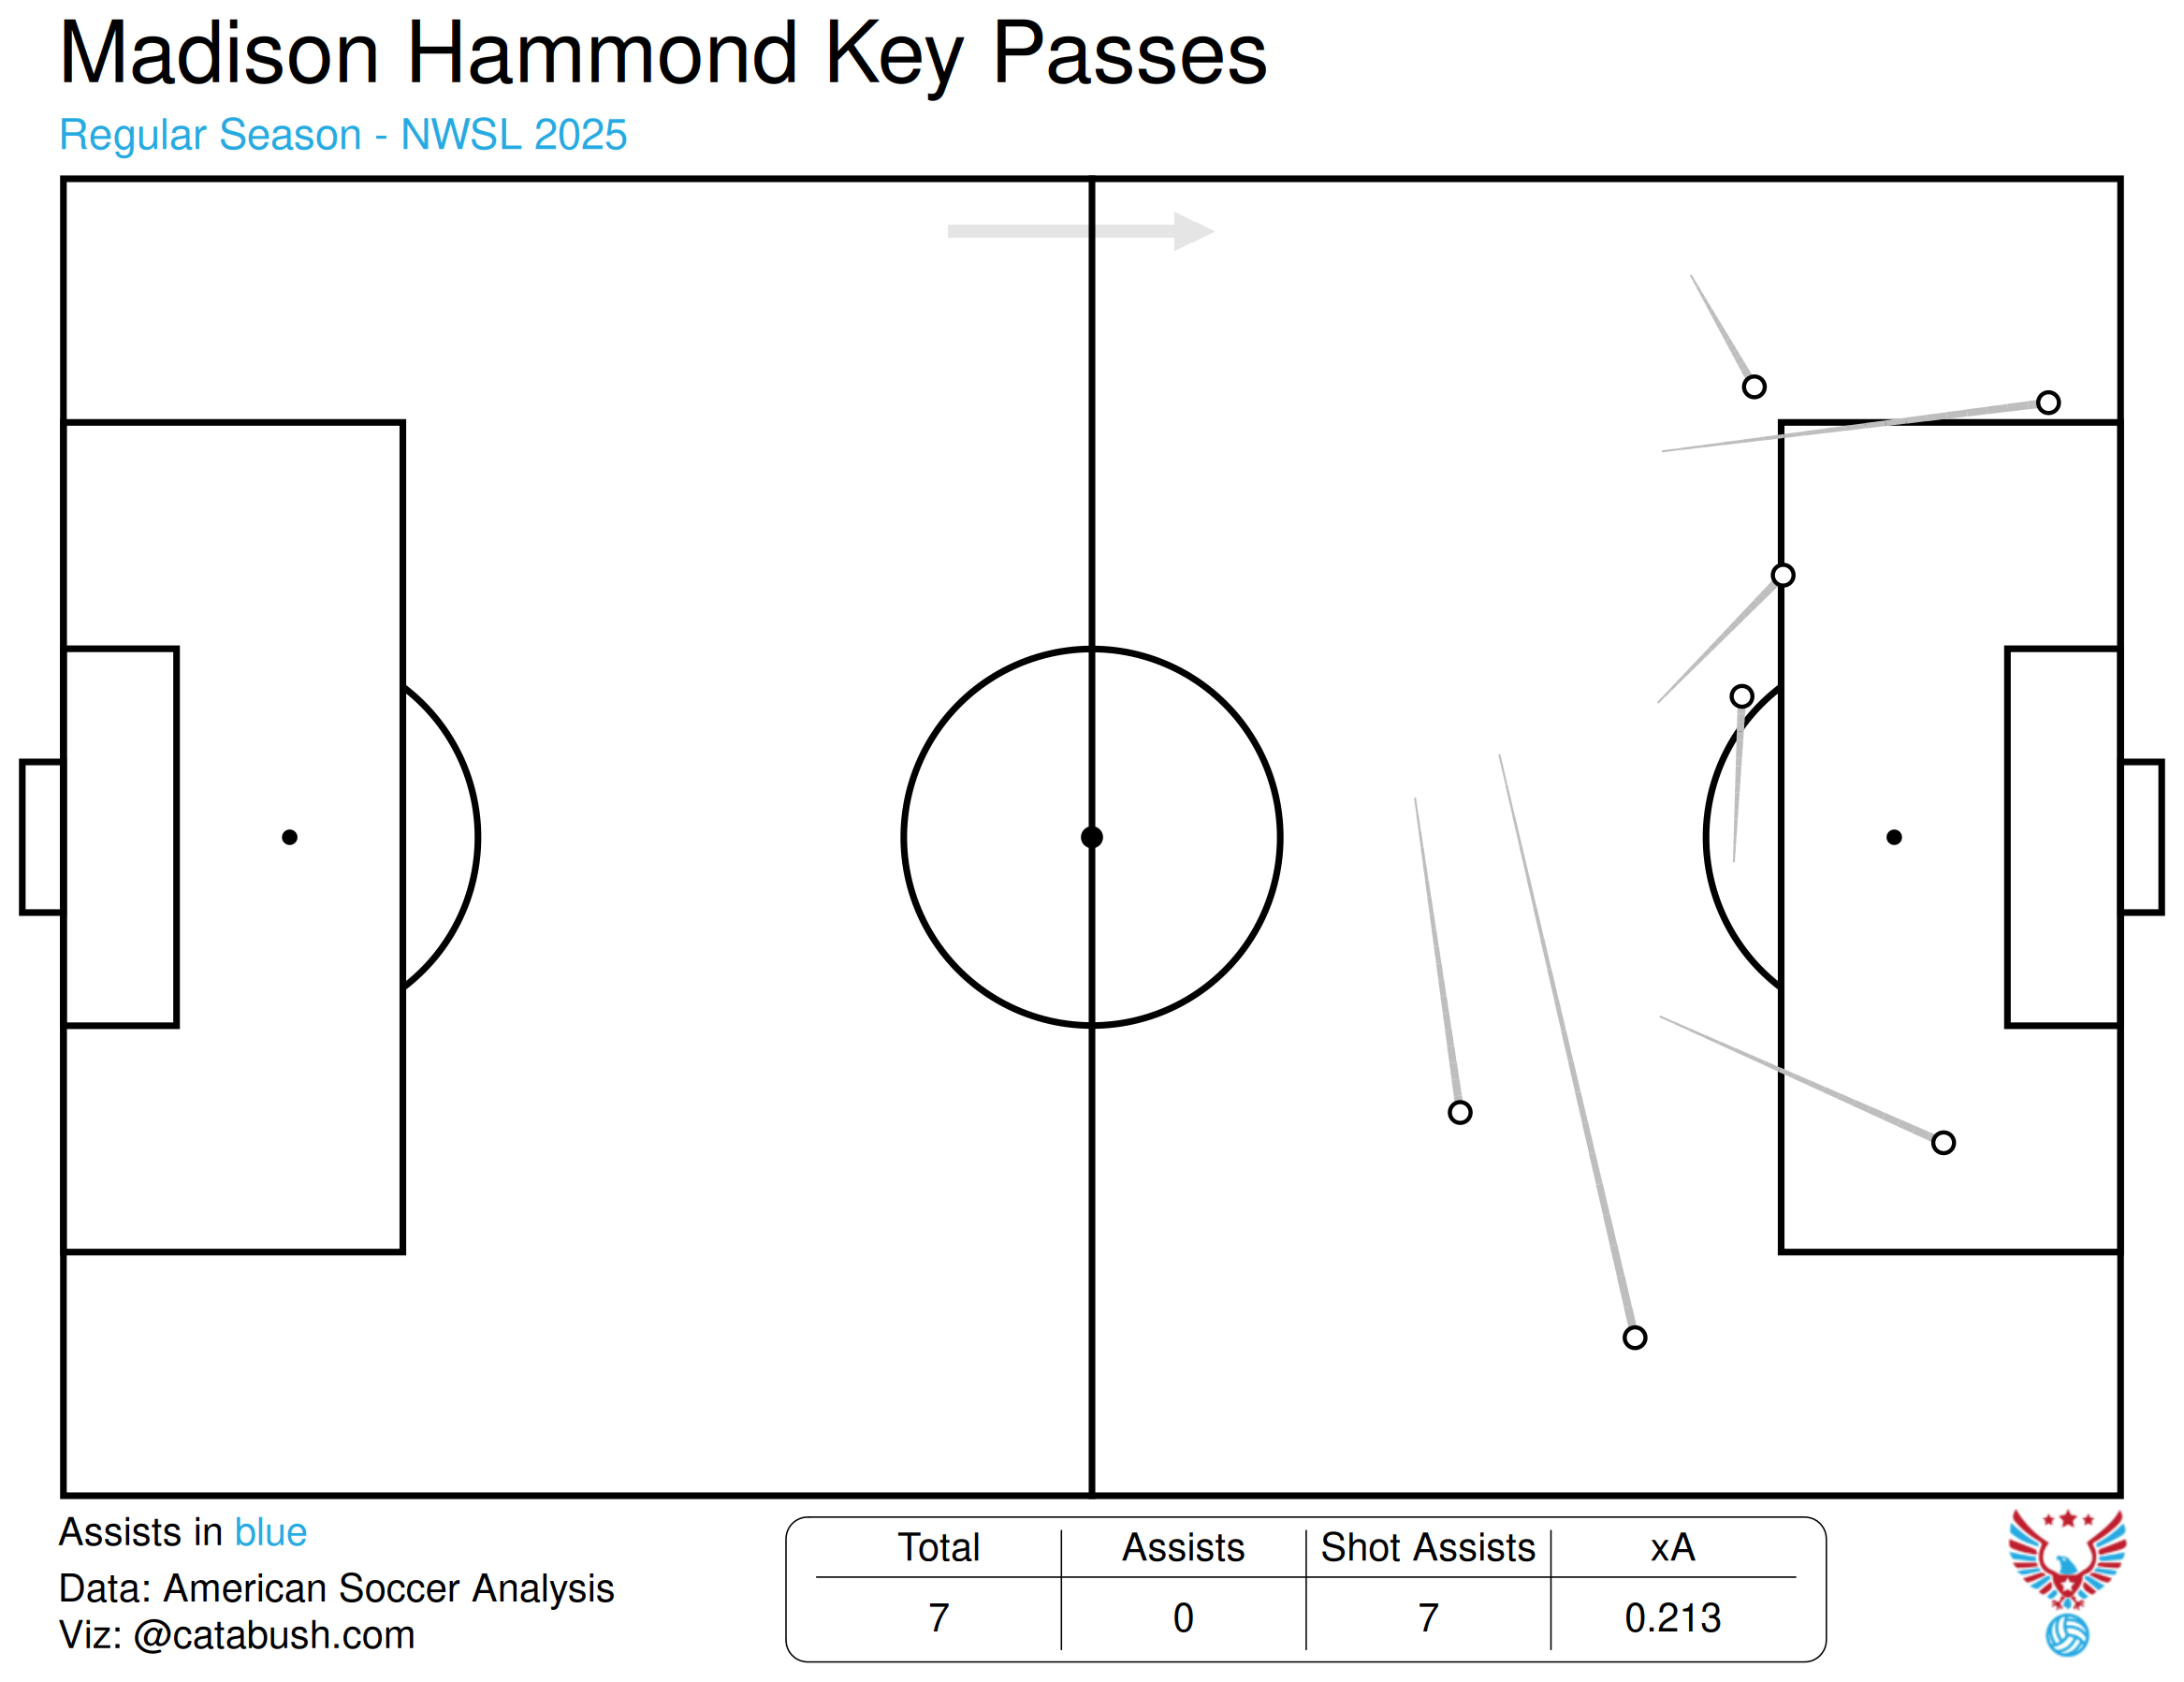
The best metrics to judge her position, I think, are Key Passes and Shot Creating Actions. Hammond’s 7 Key Passes rank in 32nd percentile of all CMs and DMs and the 21st percentile of Deep Lying Playmakers, while her 23 Shot Creating Actions are in the 42nd and 35th percentiles respectively. You can see in the chart below that few, if any of Hammond’s Key Passes are actually putting a teammate in scoring position. In most cases, the shooter had to do a lot of additional work to generate the necessary shot. I think that her 0 Assists is in fact representative of her underlying stats, and not unlucky. In terms of SCAs, Hammond’s numbers look a little better. She is in the 42nd percentile of all central midfielders and the 35th percentile of Deep Lying Playmakers. These are better contributions, but still below average.
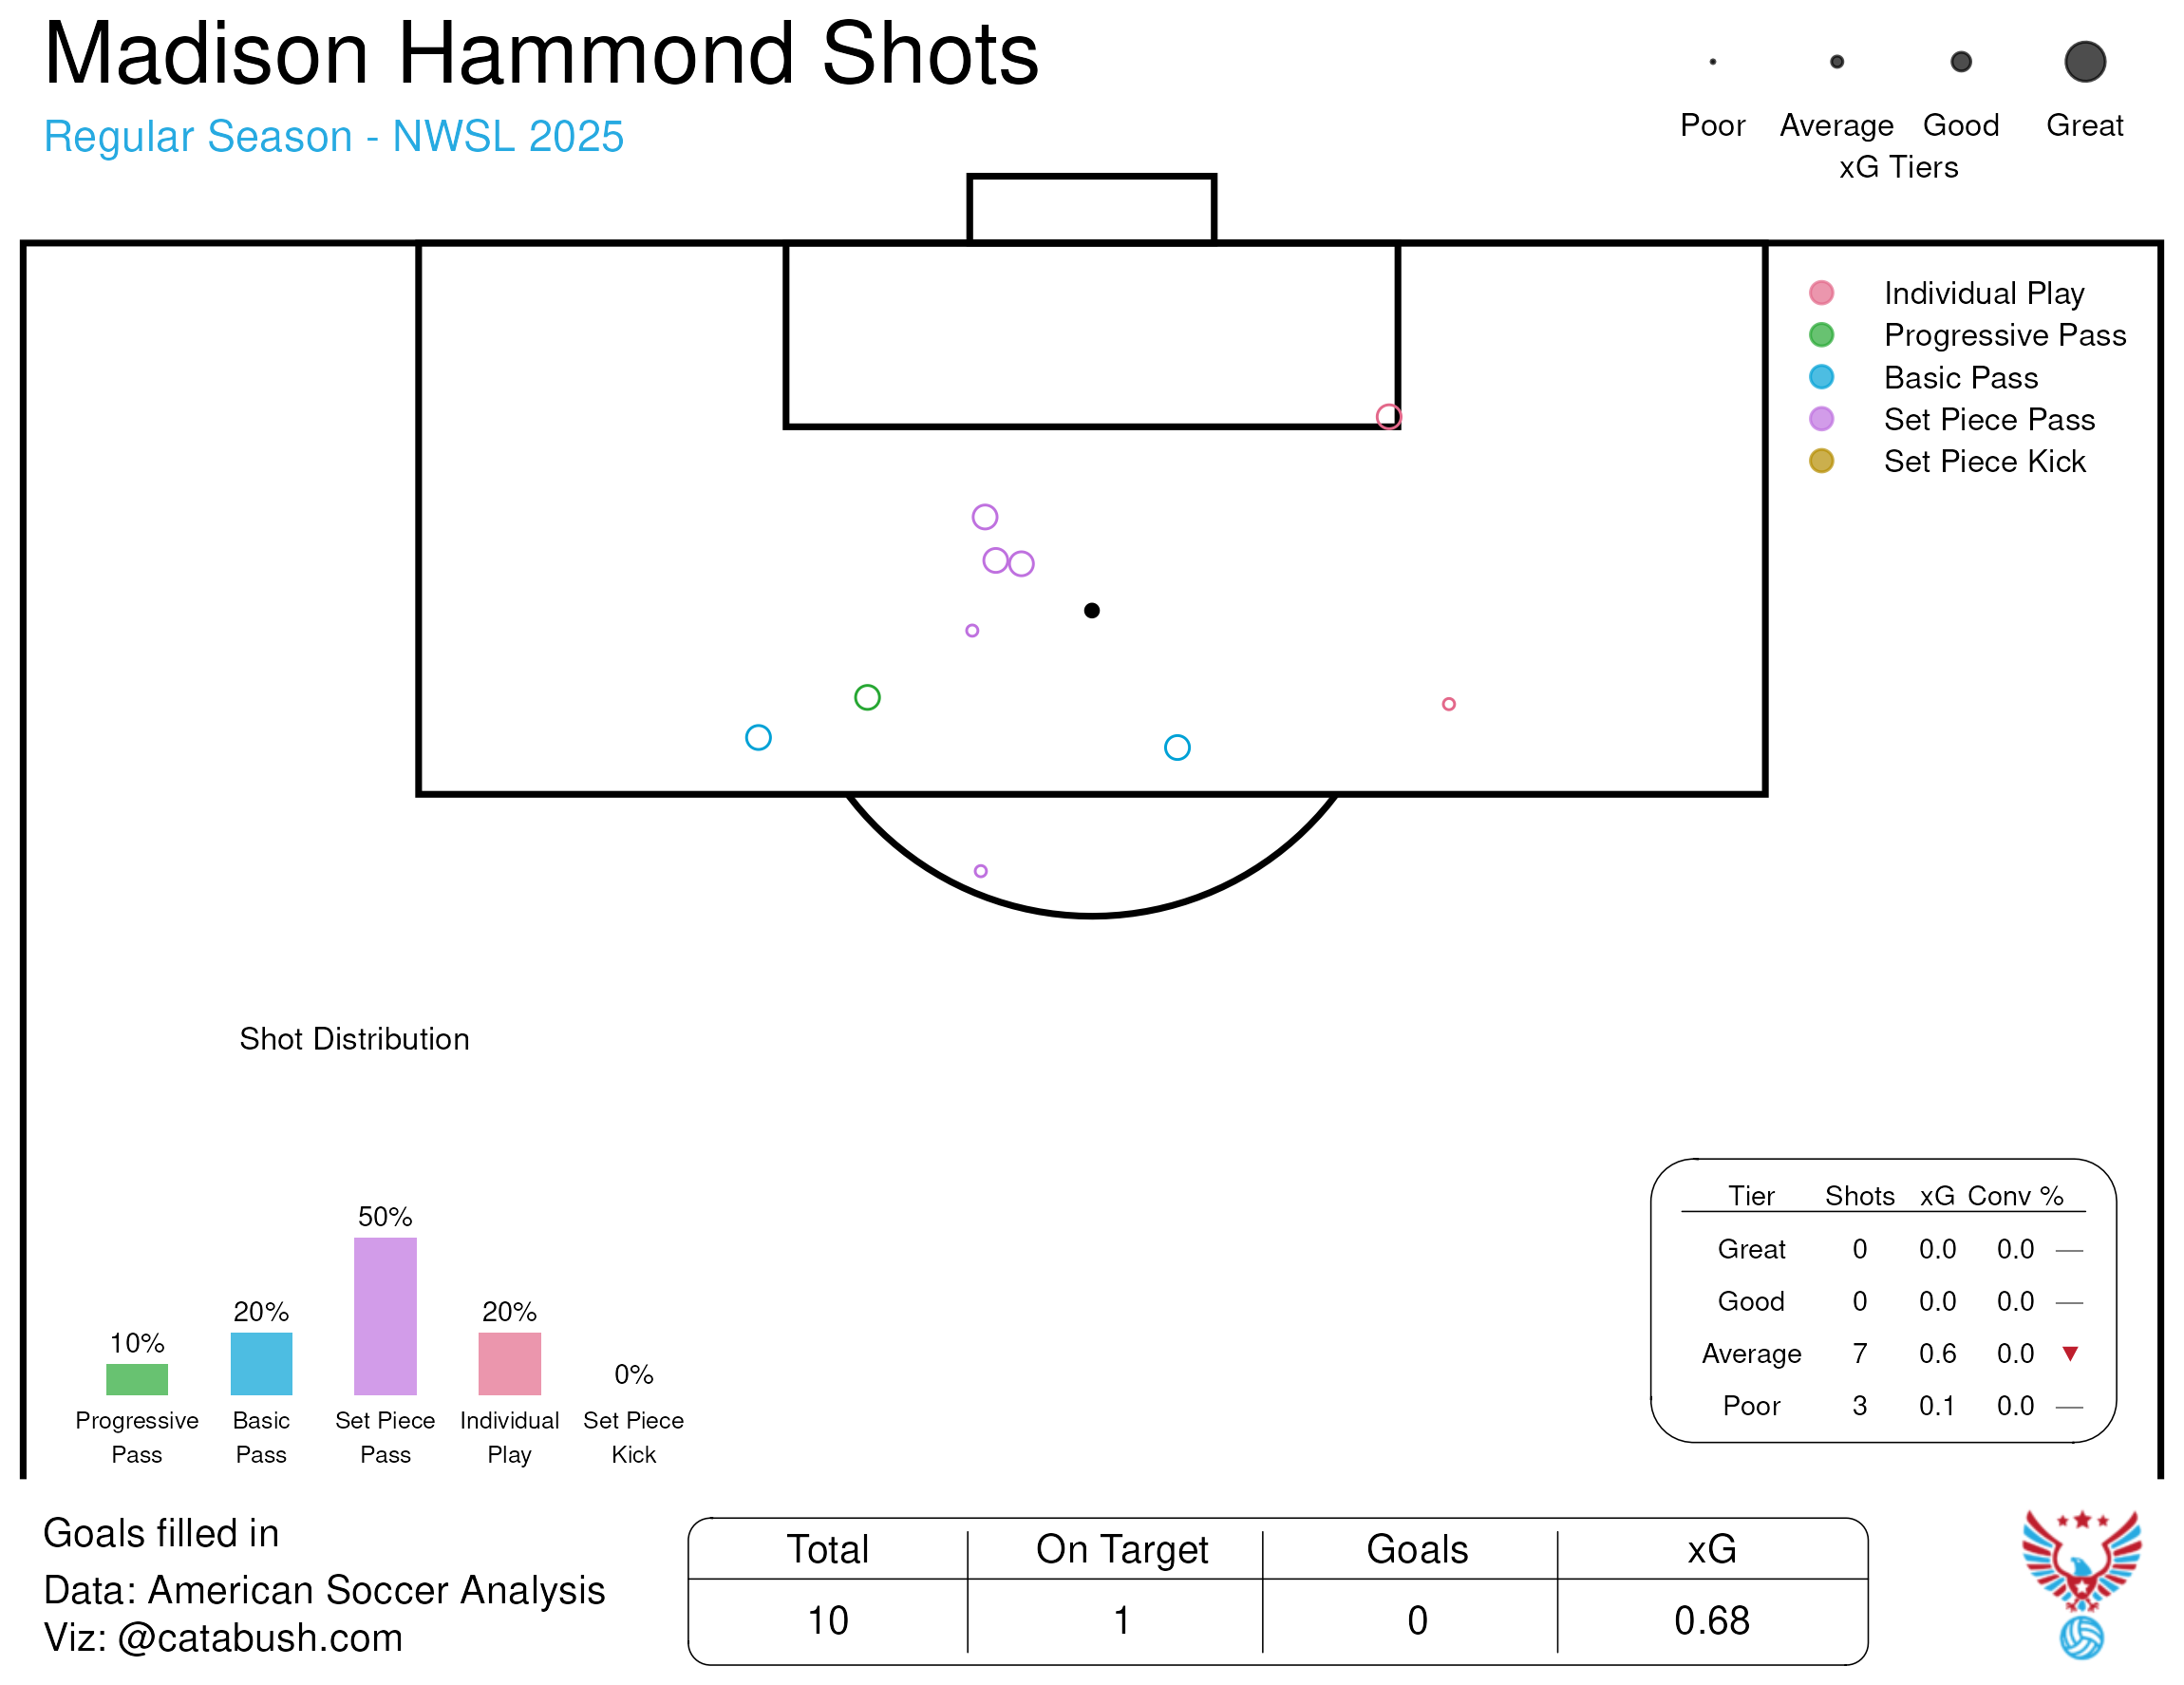
Her shooting looks much better, and I think that she was unlucky not to have scored a goal this past year. She had 10 Shots, but only 1 on Target. Half of these came from Set Pieces, in which she established herself as a viable target. I think that she does need to do a better job with just getting the ball on frame, but with ASA counting 7 of her Shots as Average, and many of them right in the middle of the box, I think that I would expect to see 1 Goal from this Shot Chart. While, I think that Hammond’s Shots are all almost taken from good spots, I would actually like to see Hammond add more shots from distance. For her position, she is generally not going to get into the box too much, but adding consistent shots on target from outside the box will add value. Even without scoring, forcing the opposing goalkeeper to tip the shot over the bar will create opportunities from corner kicks.
Defensive Contribution
Overall Hammond was solid, but not spectacular in her defensive work (the following stats are all per 90). Tackles (2.43, 61st percentile), Blocks (1.53, 73rd percentile), and Interceptions (0.87, 42nd percentile) are all comfortably in the middle of the bell curve. Her Aerial work is also in this same range: 43.8% Win Percentage (48th percentile) and 0.68 Aerial Duels Won (53.06 percentile). Her g+ score for Interrupting was -0.13 (26th percentile, but +0.23 for Fouling (89th percentile). That second part surprises me, as Hammond committed 16 Fouls, but only drew 5. ASA may be viewing this as the Fouls she committed were still to the benefit of the team, e.g. denying counterattacks. She did manage to only receive 1 Yellow Card for this, so her Fouls were not generally reckless or egregious.
One particular thing that stood out to me was how much of the field Hammond covered. Looking at the chart below, you can see that Hammond was making interventions all over the field, from sideline to sideline and box to box. While Hodge led ACFC central midfielders in Total Tackles, it was actually Hammond that led in Tackles in the Middle Third. I put a little more emphasis on this area of the pitch, as there is usually more open space here. Winning a Tackle in the Middle Third is more of a challenge, but also what you want to see from your No 6. You want them to make that stop before it gets to the defense.
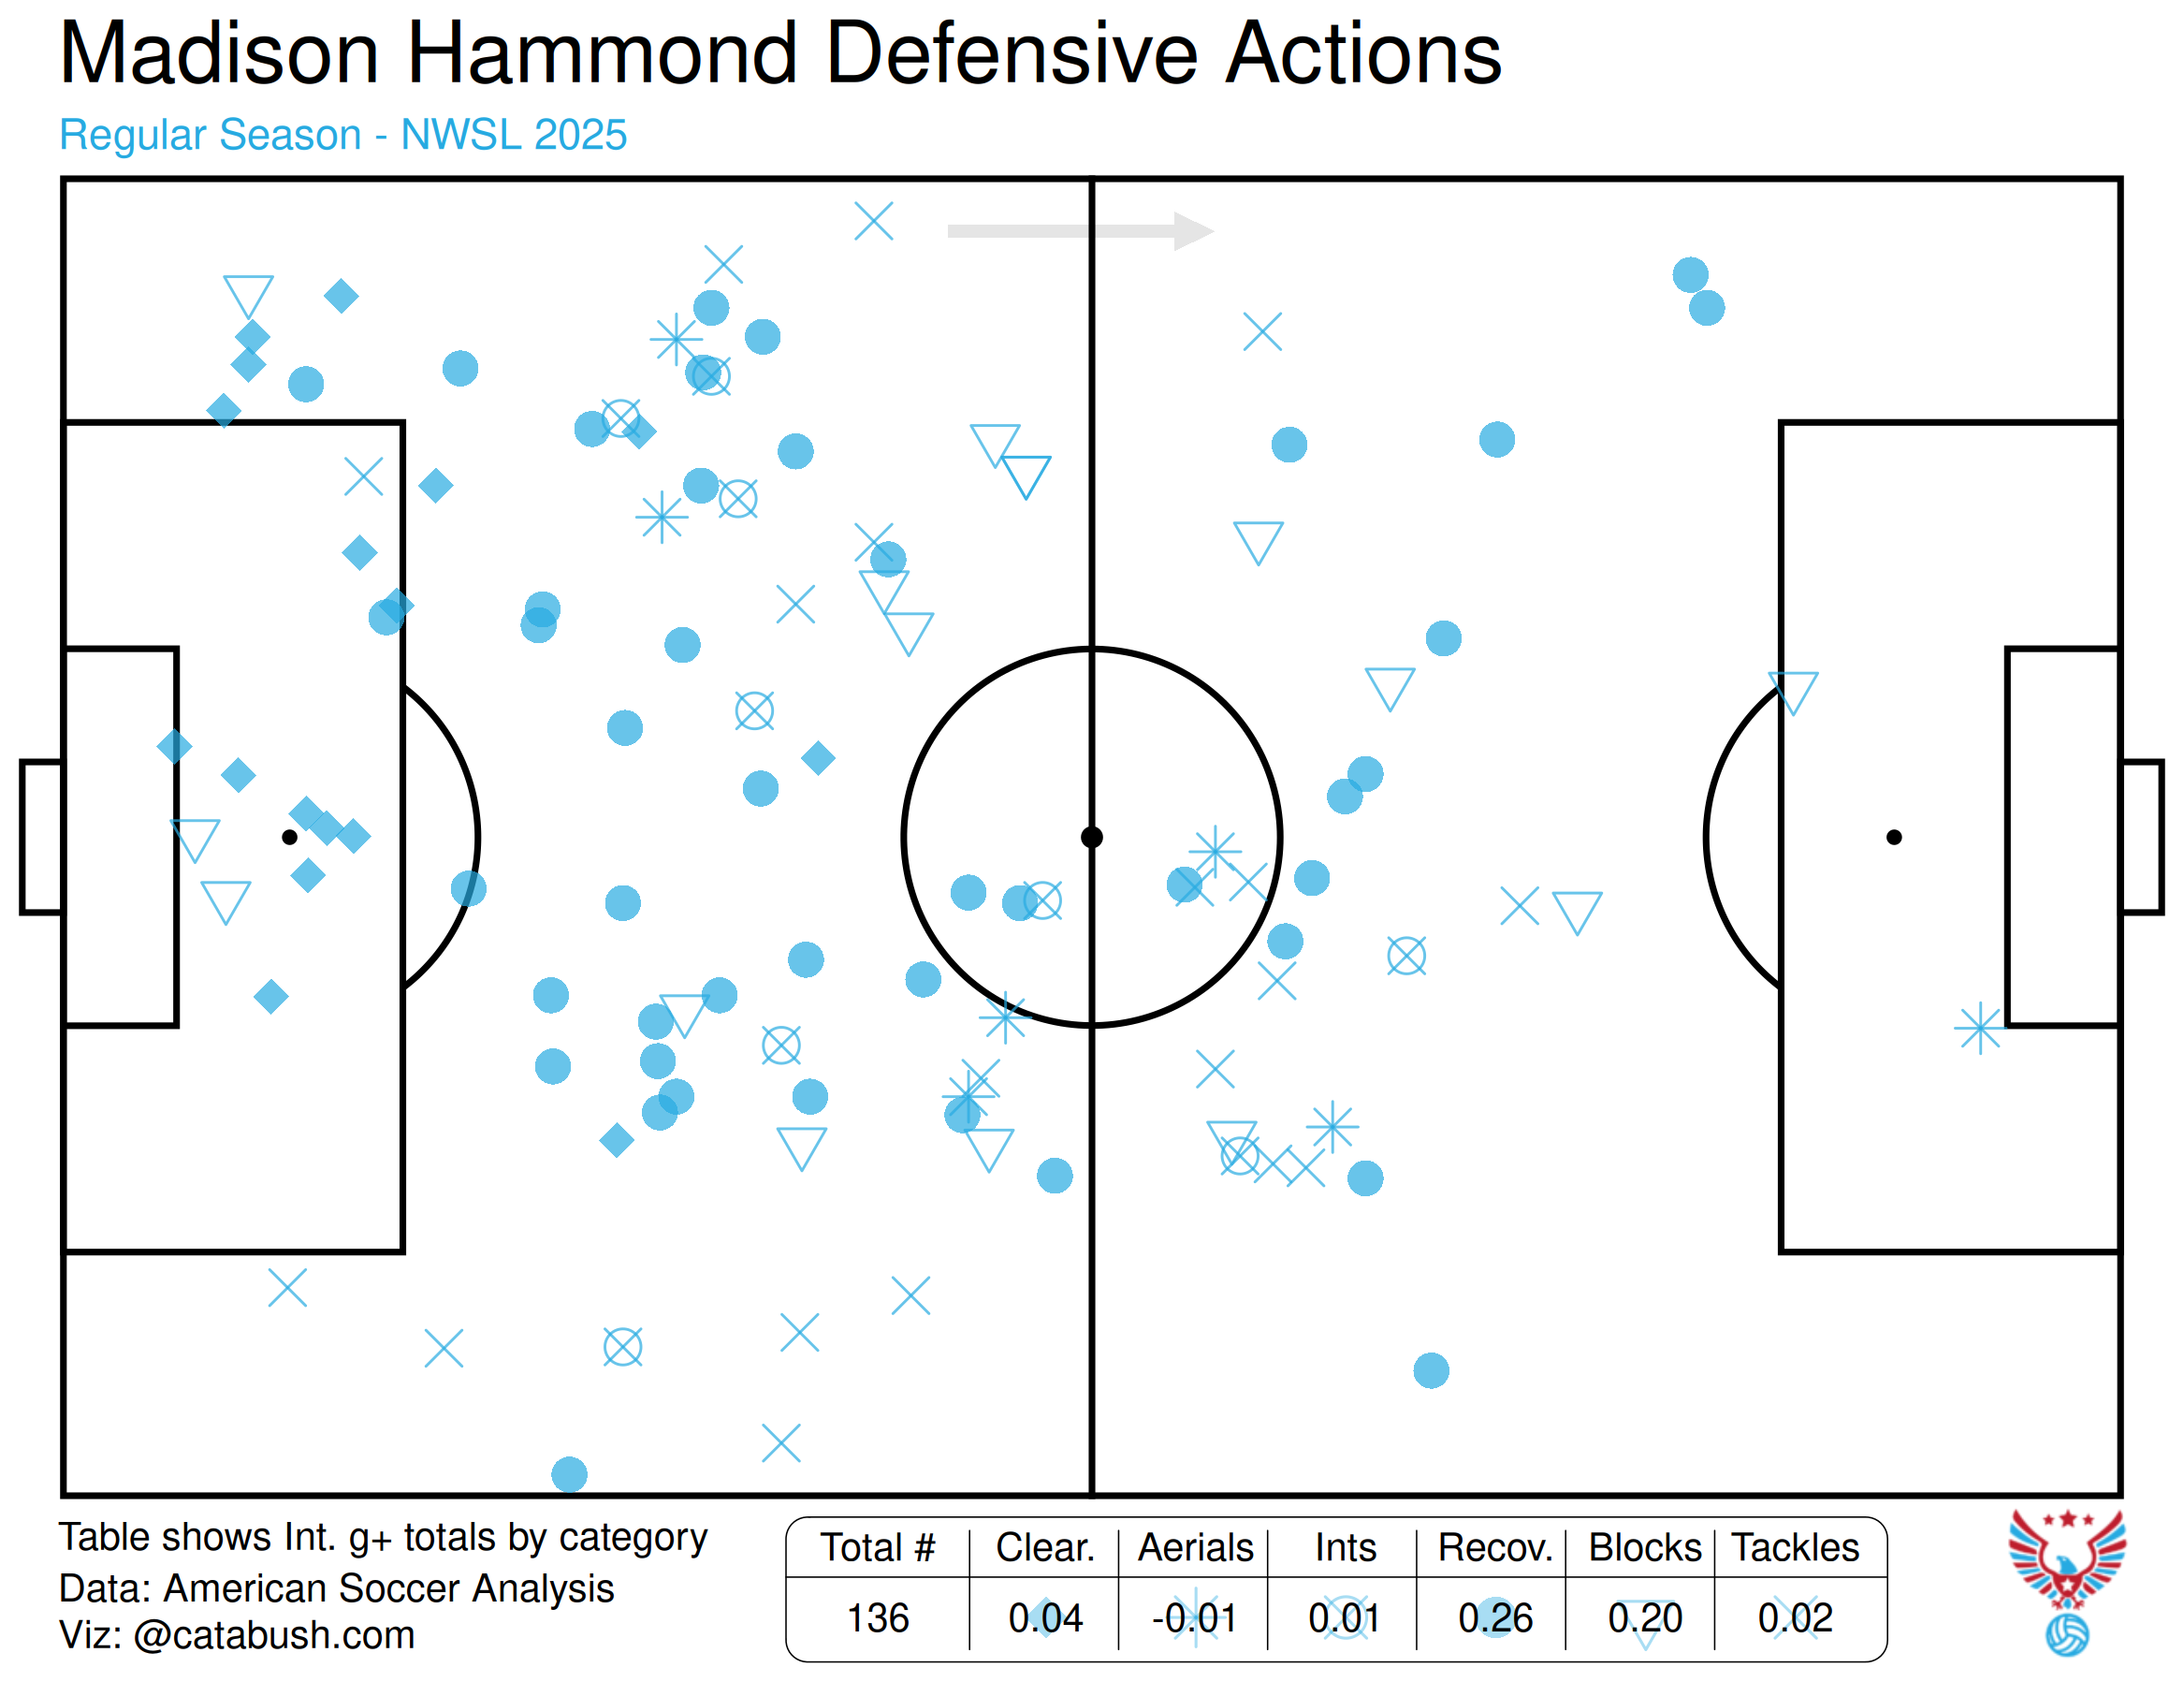
Her combined Tackles + Interceptions (3.3) is 53rd percentile, however when compared to just other Deep Lying Playmakers, Hammond rises to the 78th percentile. Some of this may be reflective of the number of attacks that Angel City’s defense would face, but I also think it’s reflective of how I would characterize Hammond. She is a little more defensive than the average playmaker and definitely a stronger passer than the average defensive midfielder. I think this is the way to view Hammond, primarily as a passer, but one that can be trusted defensively, if necessary.
Possession
Hammond had a somewhat smaller number of Touches: 52.72 Touches per 90, which was 4.7% of her team’s total (22nd percentile). Part of this may be affected by the high number of substitute appearances that she made, and the fact that Angel City was usually chasing games when she come on. Her g+ score for Receiving was -0.3 (48th percentile), and I think that this is an area in which she does need to improve, and I think is actually tied into her Passing. I’d often see Hammond dropping too deep to receive a pass, being blocked from the ball carrier, or just not in enough space when she received the pass to turn and play the ball up field. If she improved her positioning, I think that the other aspects of her game would also improve. In fairness, she may be prioritizing defensive positioning, and setting herself to disrupt a counterattack if the ball is turned over (which is a valid concern). But I think that the best No 6s can find a way to do both of these things.
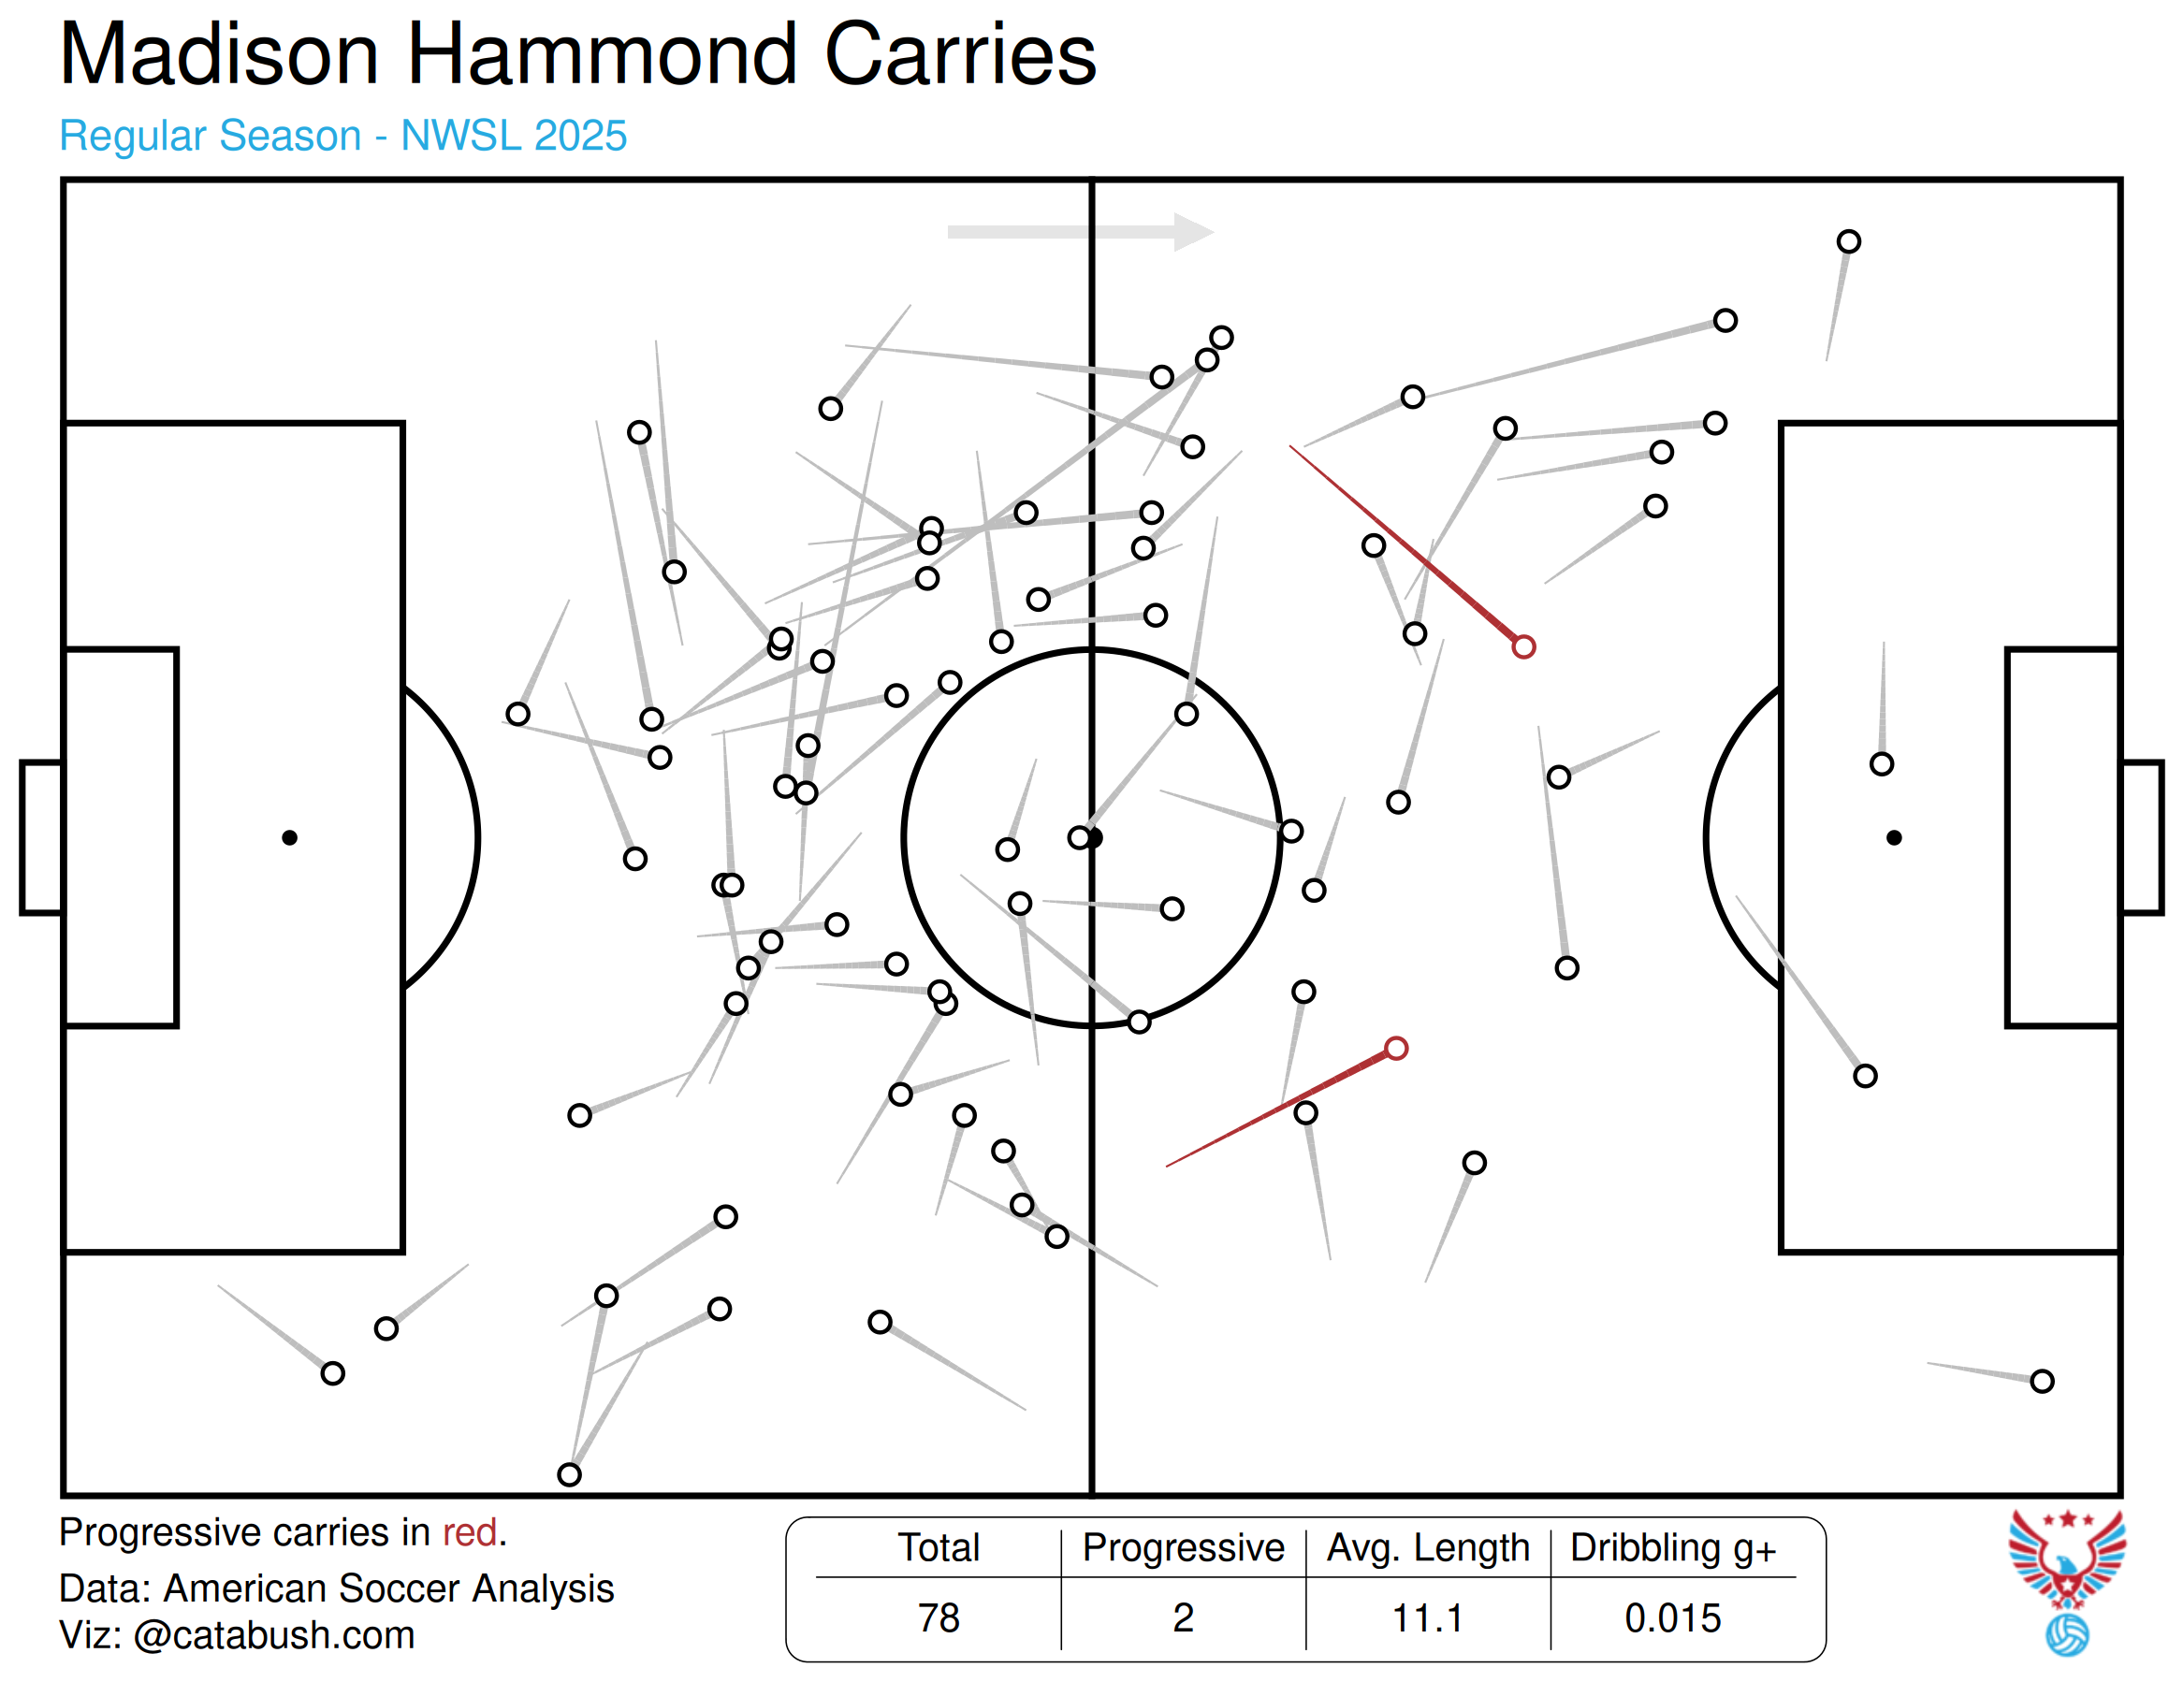
Hammond’s Dribbling numbers looked surprisingly good, as that’s not really an area in which I thought of as part of her game. She averaged 25.44 Carries (57th percentile), but only 0.49 Progressive Carries (28th percentile). ASA actually credits her with even fewer Progressive Carries, however they do give her value for her Carries. Her g+ score for Dribbling was +0.04 (77th percentile). This looks particularly good when compared with the other Deep Lying Playmakers, as only Sam Coffey had g+ Dribbling score above +0.07. And while Hammond’s dribbling never caught my eye when I watched her, I did always think that she looked very comfortable on the ball.
Conclusions
I think that Hammond is a good, but not great, NWSL No 6. My feeling is that any team in the league would be happy to have her on their roster, especially teams that play more of a possession style, but not that many teams would have her as a starter. She was a free agent at the end of the season and signed a new deal with Utah pretty early on. I think that this is actually one of the best landing spots she could have had. With Claudia Zornoza retiring, Hammond has an opportunity to take over a starting role, and if she approaches the 10.4% Touches and 50 Total Pass Attempts that Zornoza averaged, I think that Hammond could have a lot of success. Possibly the only better spot would have been if Hammond had gone to the Wave, as I can see her as a good partner to Dali. I would definitely consider Hammond as an upgrade to McCaskill in this role, as I think that Hammond covers more ground and is stronger defensively, but at the time that Hammond signed with Utah, McCaskill hadn’t yet left San Diego.
I would have liked to see Hammond stay, but it was clear that Straus didn’t plan on giving Hammond a prominent role in 2026. At age 28, Hammond should be taking her shot at being a starter in the league. That wasn’t going to happen at Angel City, so I think this was the right move for all parties, and I wish her the best in her career.
Hodge was something of a puzzle for me at the start of the season. To me, she always seemed quite limited, but I know a number of other people valued her quite highly. Sam Laity was clearly one of these people, as he started her in four of the first five matches, notably leaving Zelem on the bench. I’m going to include some of Zelem’s numbers here for comparison, since she and Hodge were often competing for the same minutes, and because I will not be doing a complete evaluation on Zelem.
Hodge played in 16 matches, with 9 starts, for a total of 755 minutes. She had 6 matches as an unused substitute, including the final three matches of the season. She only went the full 90 in 2 matches. As with Hammond, it appears that once Martin and Sugita joined the team, they were immediately preferred over Hodge.
Passing
As I stated above, I think that passing is the most important job for a midfielder, and this may be why Hodge didn’t impress me. Pass Attempts (32.5, 22nd percentile), Completion Percentage (70%, 12th percentile), Long Attempts (2.14, 8th percentile), Progressive Passes (3.09, 22nd percentile), Passes into the Attacking Third (2.14, 14th percentile), and Passes into the Penalty Area (0.11, 8th percentile) are all firmly among the worst marks among NWSL midfielders. I wanted to see if this was unfair, however, as her primary job did seem to be defensive work. My unsupervised clustering model classified Hodge as a Defensive Midfielder, which seemed accurate, so I compared her to only the other players in her cluster. However, even in this group, Hodge still had the second worst Pass Completion Percentage. What is interesting is that Hodge actually did pass the ball more than many of her Defensive Midfield counterparts. Her Pass Attempts put her in the 66th percentile of this group, but she still had the second lowest Total Passing Distance, and the third lowest Progressive Passing Distance of the cluster. So even amongst midfielders who are primarily deployed for defense work, Hodge’s passing leaves a lot to be desired.
ASA’s statistics also provide some interesting insight. Hodge’s xPass score was -8.75 (or she completed 8.75 fewer passes than the model expects), which is in the 16th percentile of all central midfielders. However, most of the players with lower scores also played more minutes. On a per 100 basis, Hodge’s -3.23 is in the 10th percentile. Her vertical score does look better. Hodge aveaged 3.16 Vertical yards on her completed passes (46th percentile). The Passing portion of her g+ score was -0.23 (24th percentile).
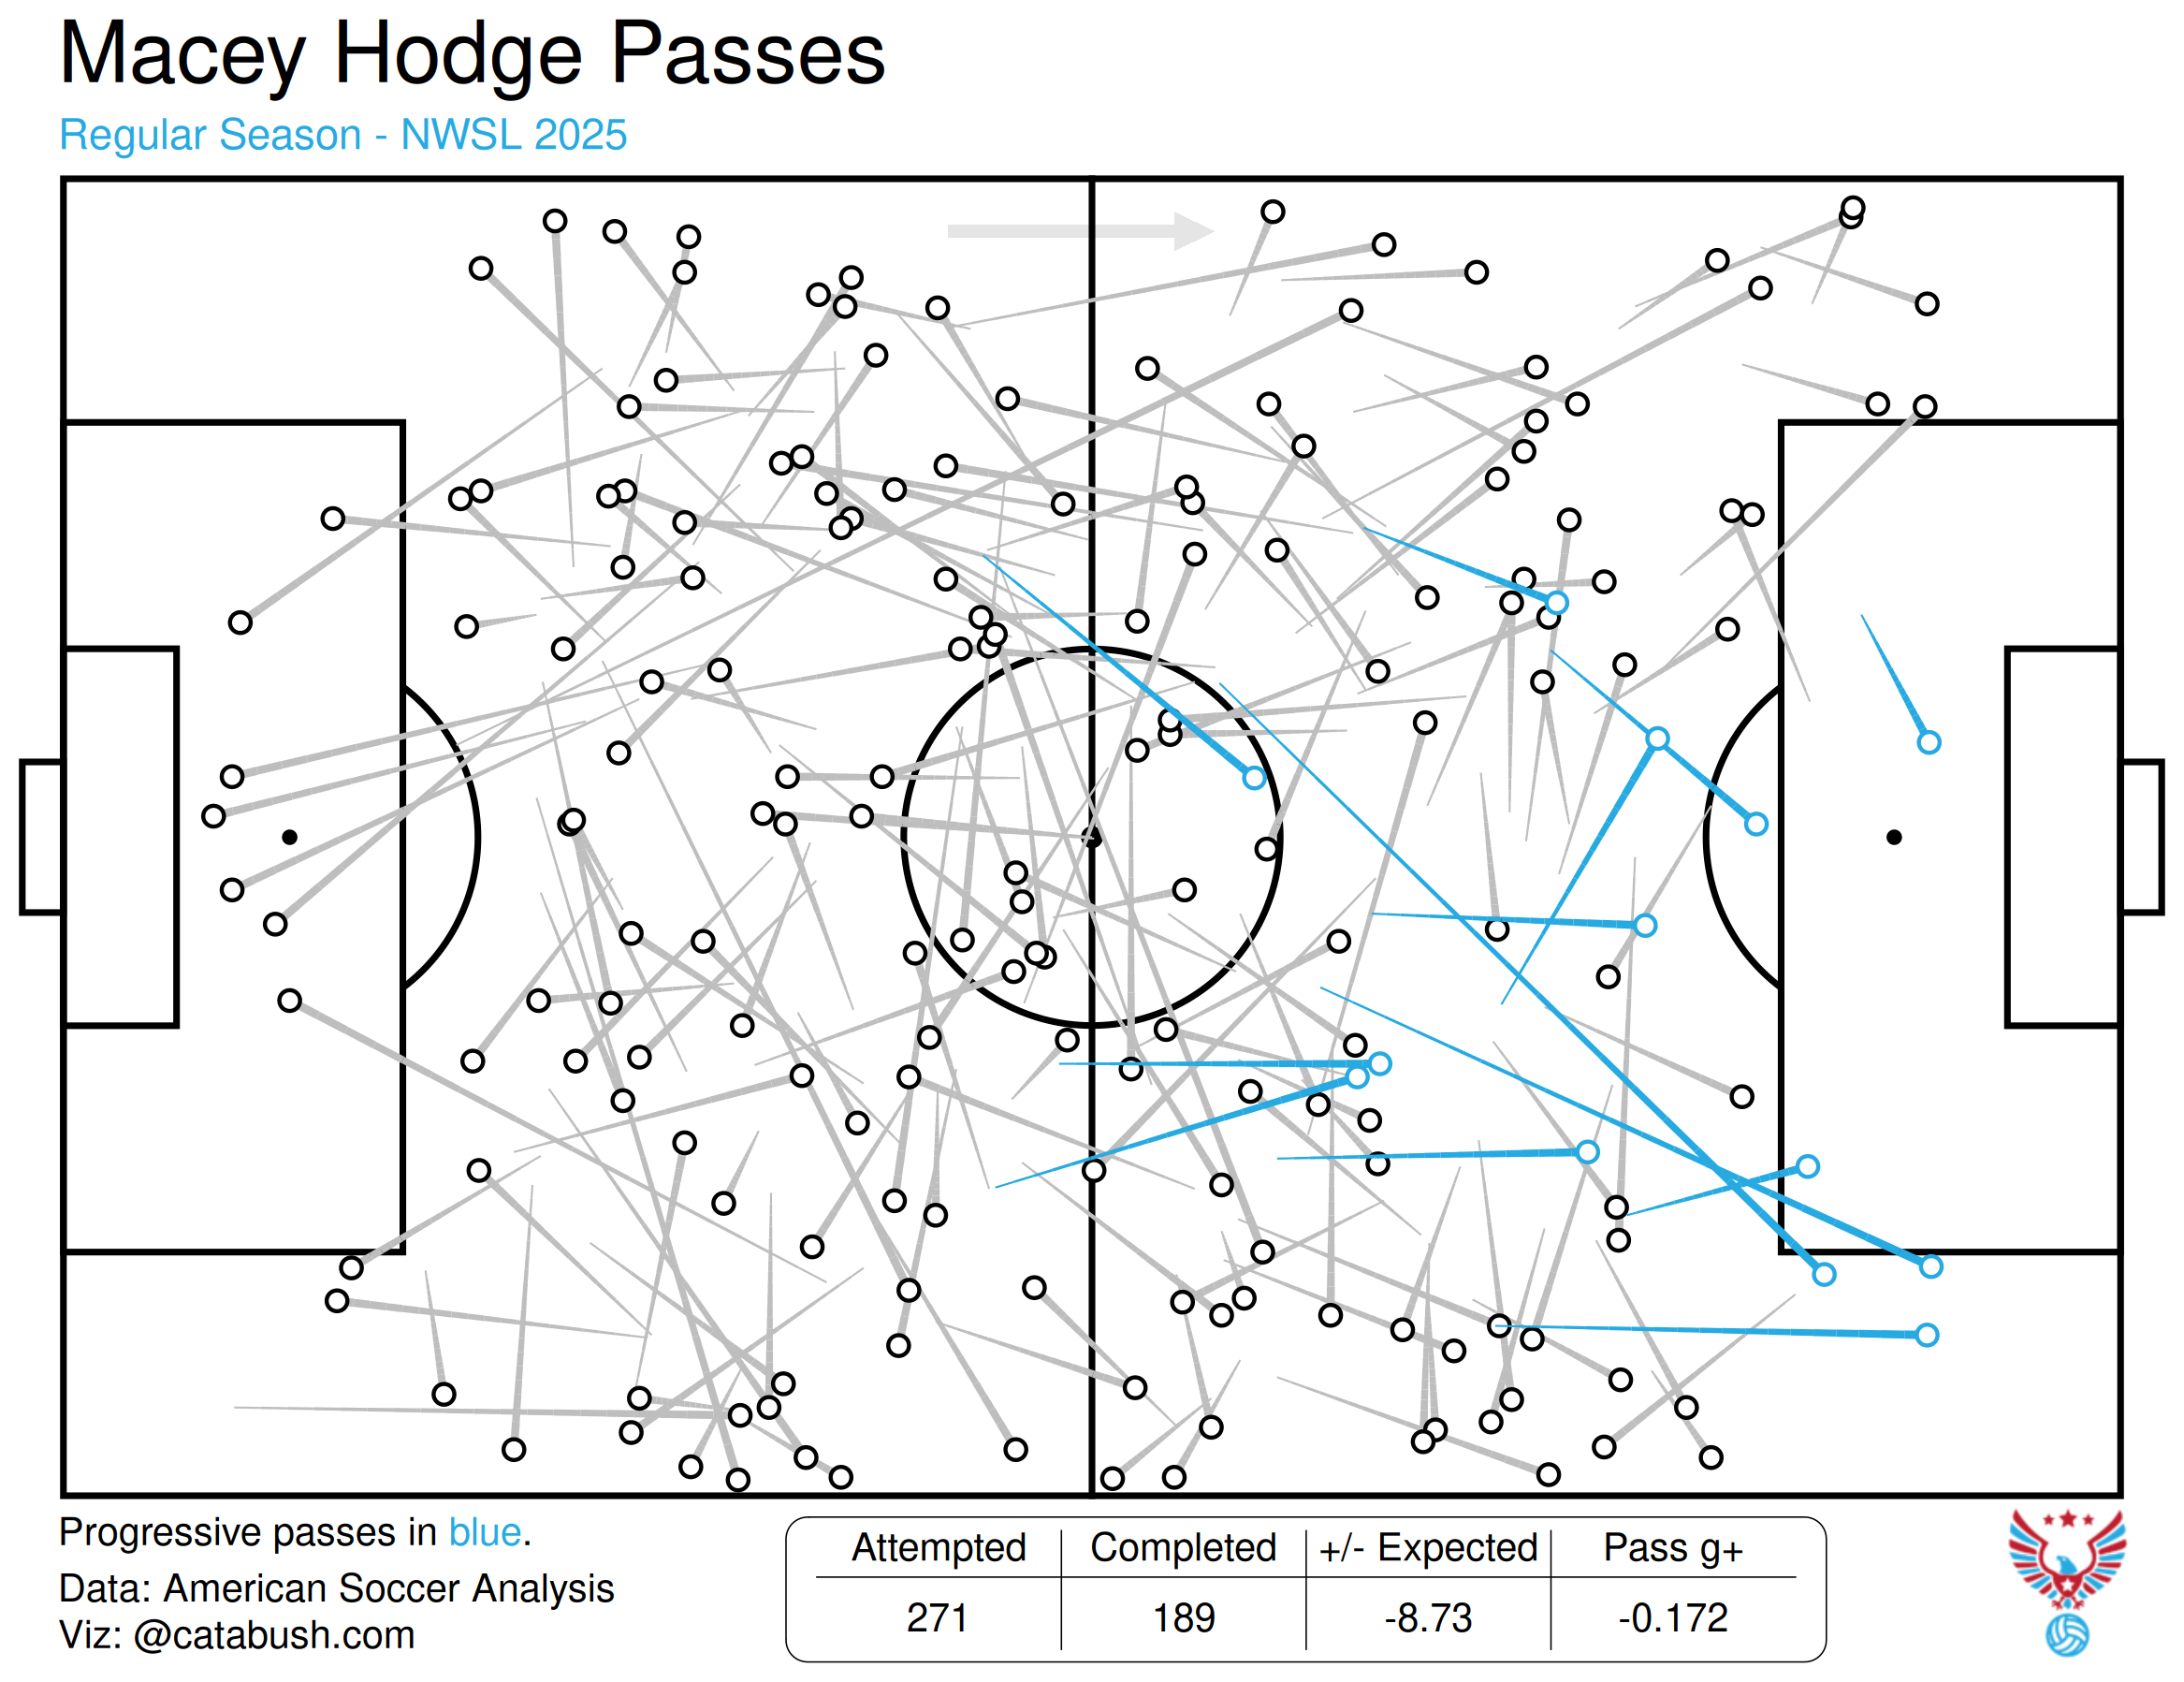
My final evaluation of her passing, combining this data with my own observations, is that this is definitely a weakness in Hodge’s game. She doesn’t demonstrate great accuracy or passing range. Looking at the chart above, the passes are kind of all over the place. You do see some very aggressive progressive passes. But there are also a lot of safe, backwards passes. I’m a little surprised that number of lateral and backward passes in the opposition half. What strikes me the most about this passing chart is that it does seem to be all over the place. There are no clear patterns of play or a feeling of intention in her passing.
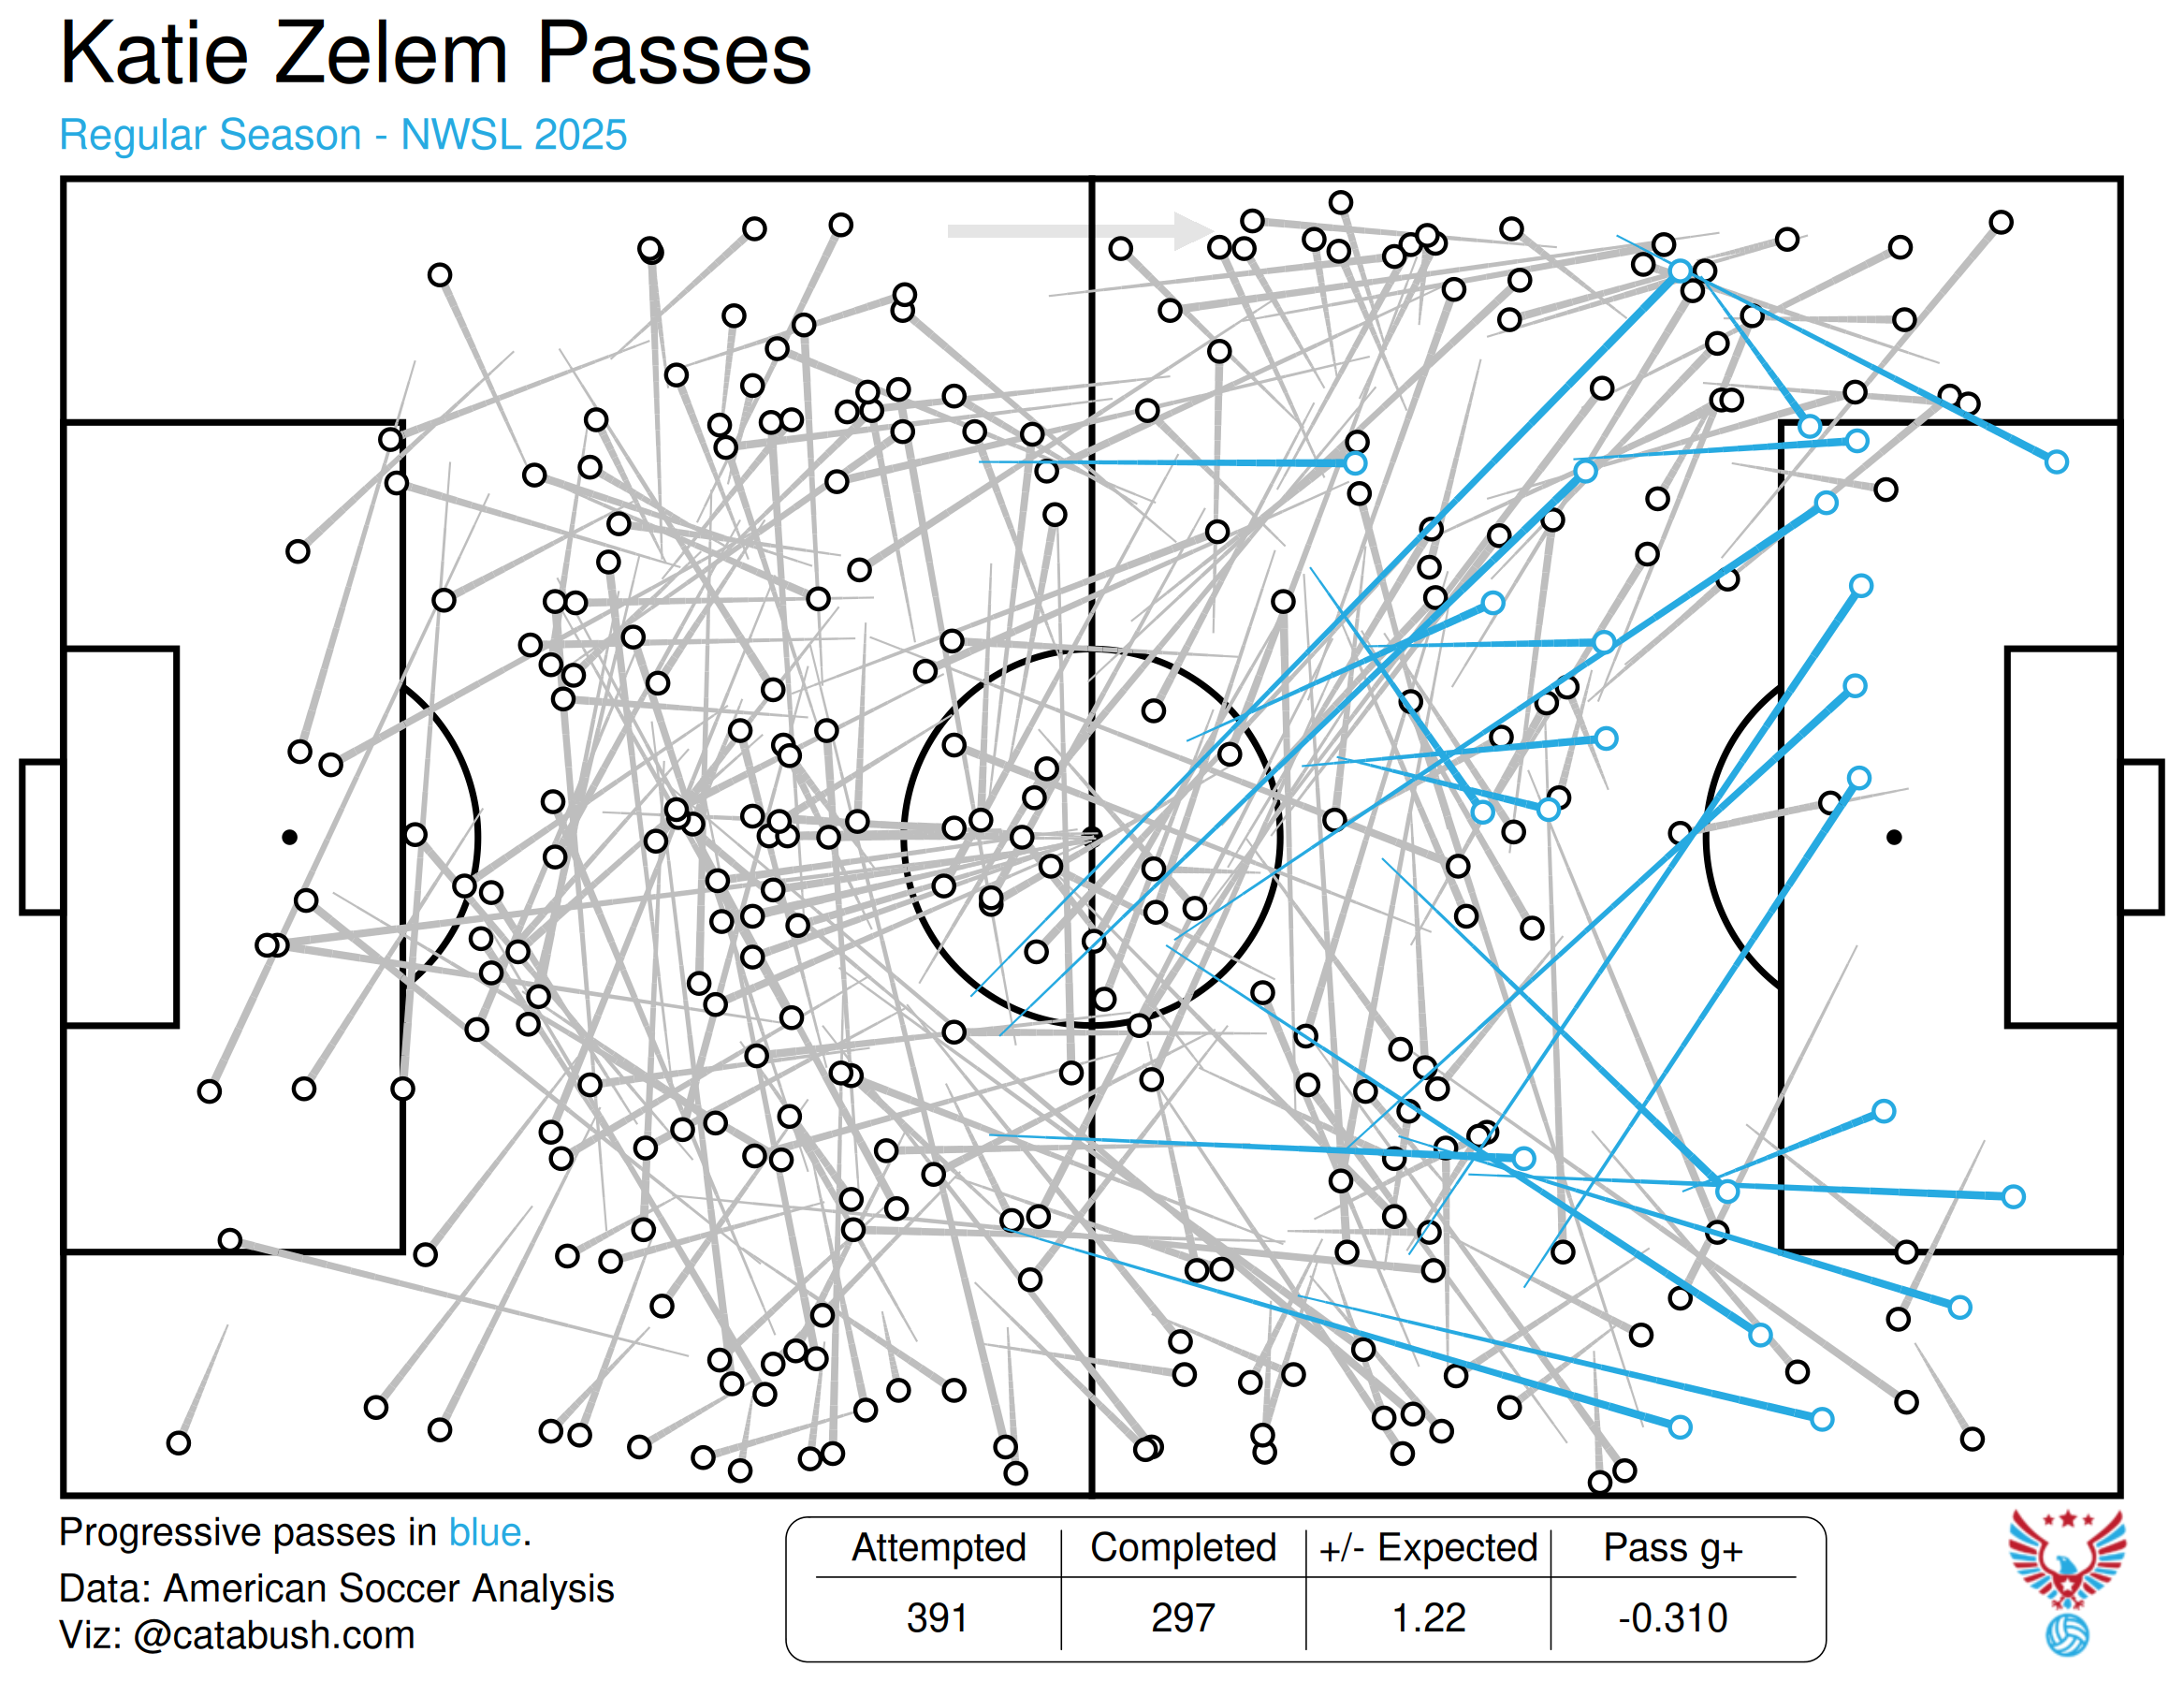
Zelem, in contrast, is a player that I feel like needs a high volume of passes to be effective, and is not the cleanest passer that I’ve seen, but I do feel like she is a stronger passer than Hodge. Her Pass Completion Percentage (75.9%, 51st percentile) and xPass (+1.22, 46th percentile) are higher than Hodge. Zelem also led the league in Long Pass Attempts (12.77) and was in the 93rd percentile in Progressive Passes (6.31), showing a Passing range that Hodge doesn’t yet have. It is true that a lot of Zelem’s passes don’t work, and indeed, the Passing Portion of her g+ score is -0.36 (8th percentile) and worse than Hodge. I think, though, that this is due to Zelem attempting almost twice as many passes per game than Hodge (60.6 to 32.5). Despite the somewhat better accuracy, Zelem has significantly more turnovers corresponding with her significantly higher attempts, and turnovers, of course, have negative value.
In contrast to Hodge, Zelem does demonstrate a clearer idea in her passing. In Angel City’s half, it is a lot of getting the ball out to the fullbacks. In the Opposition half, it is about getting the ball out to the wings.
Offensive Contributions
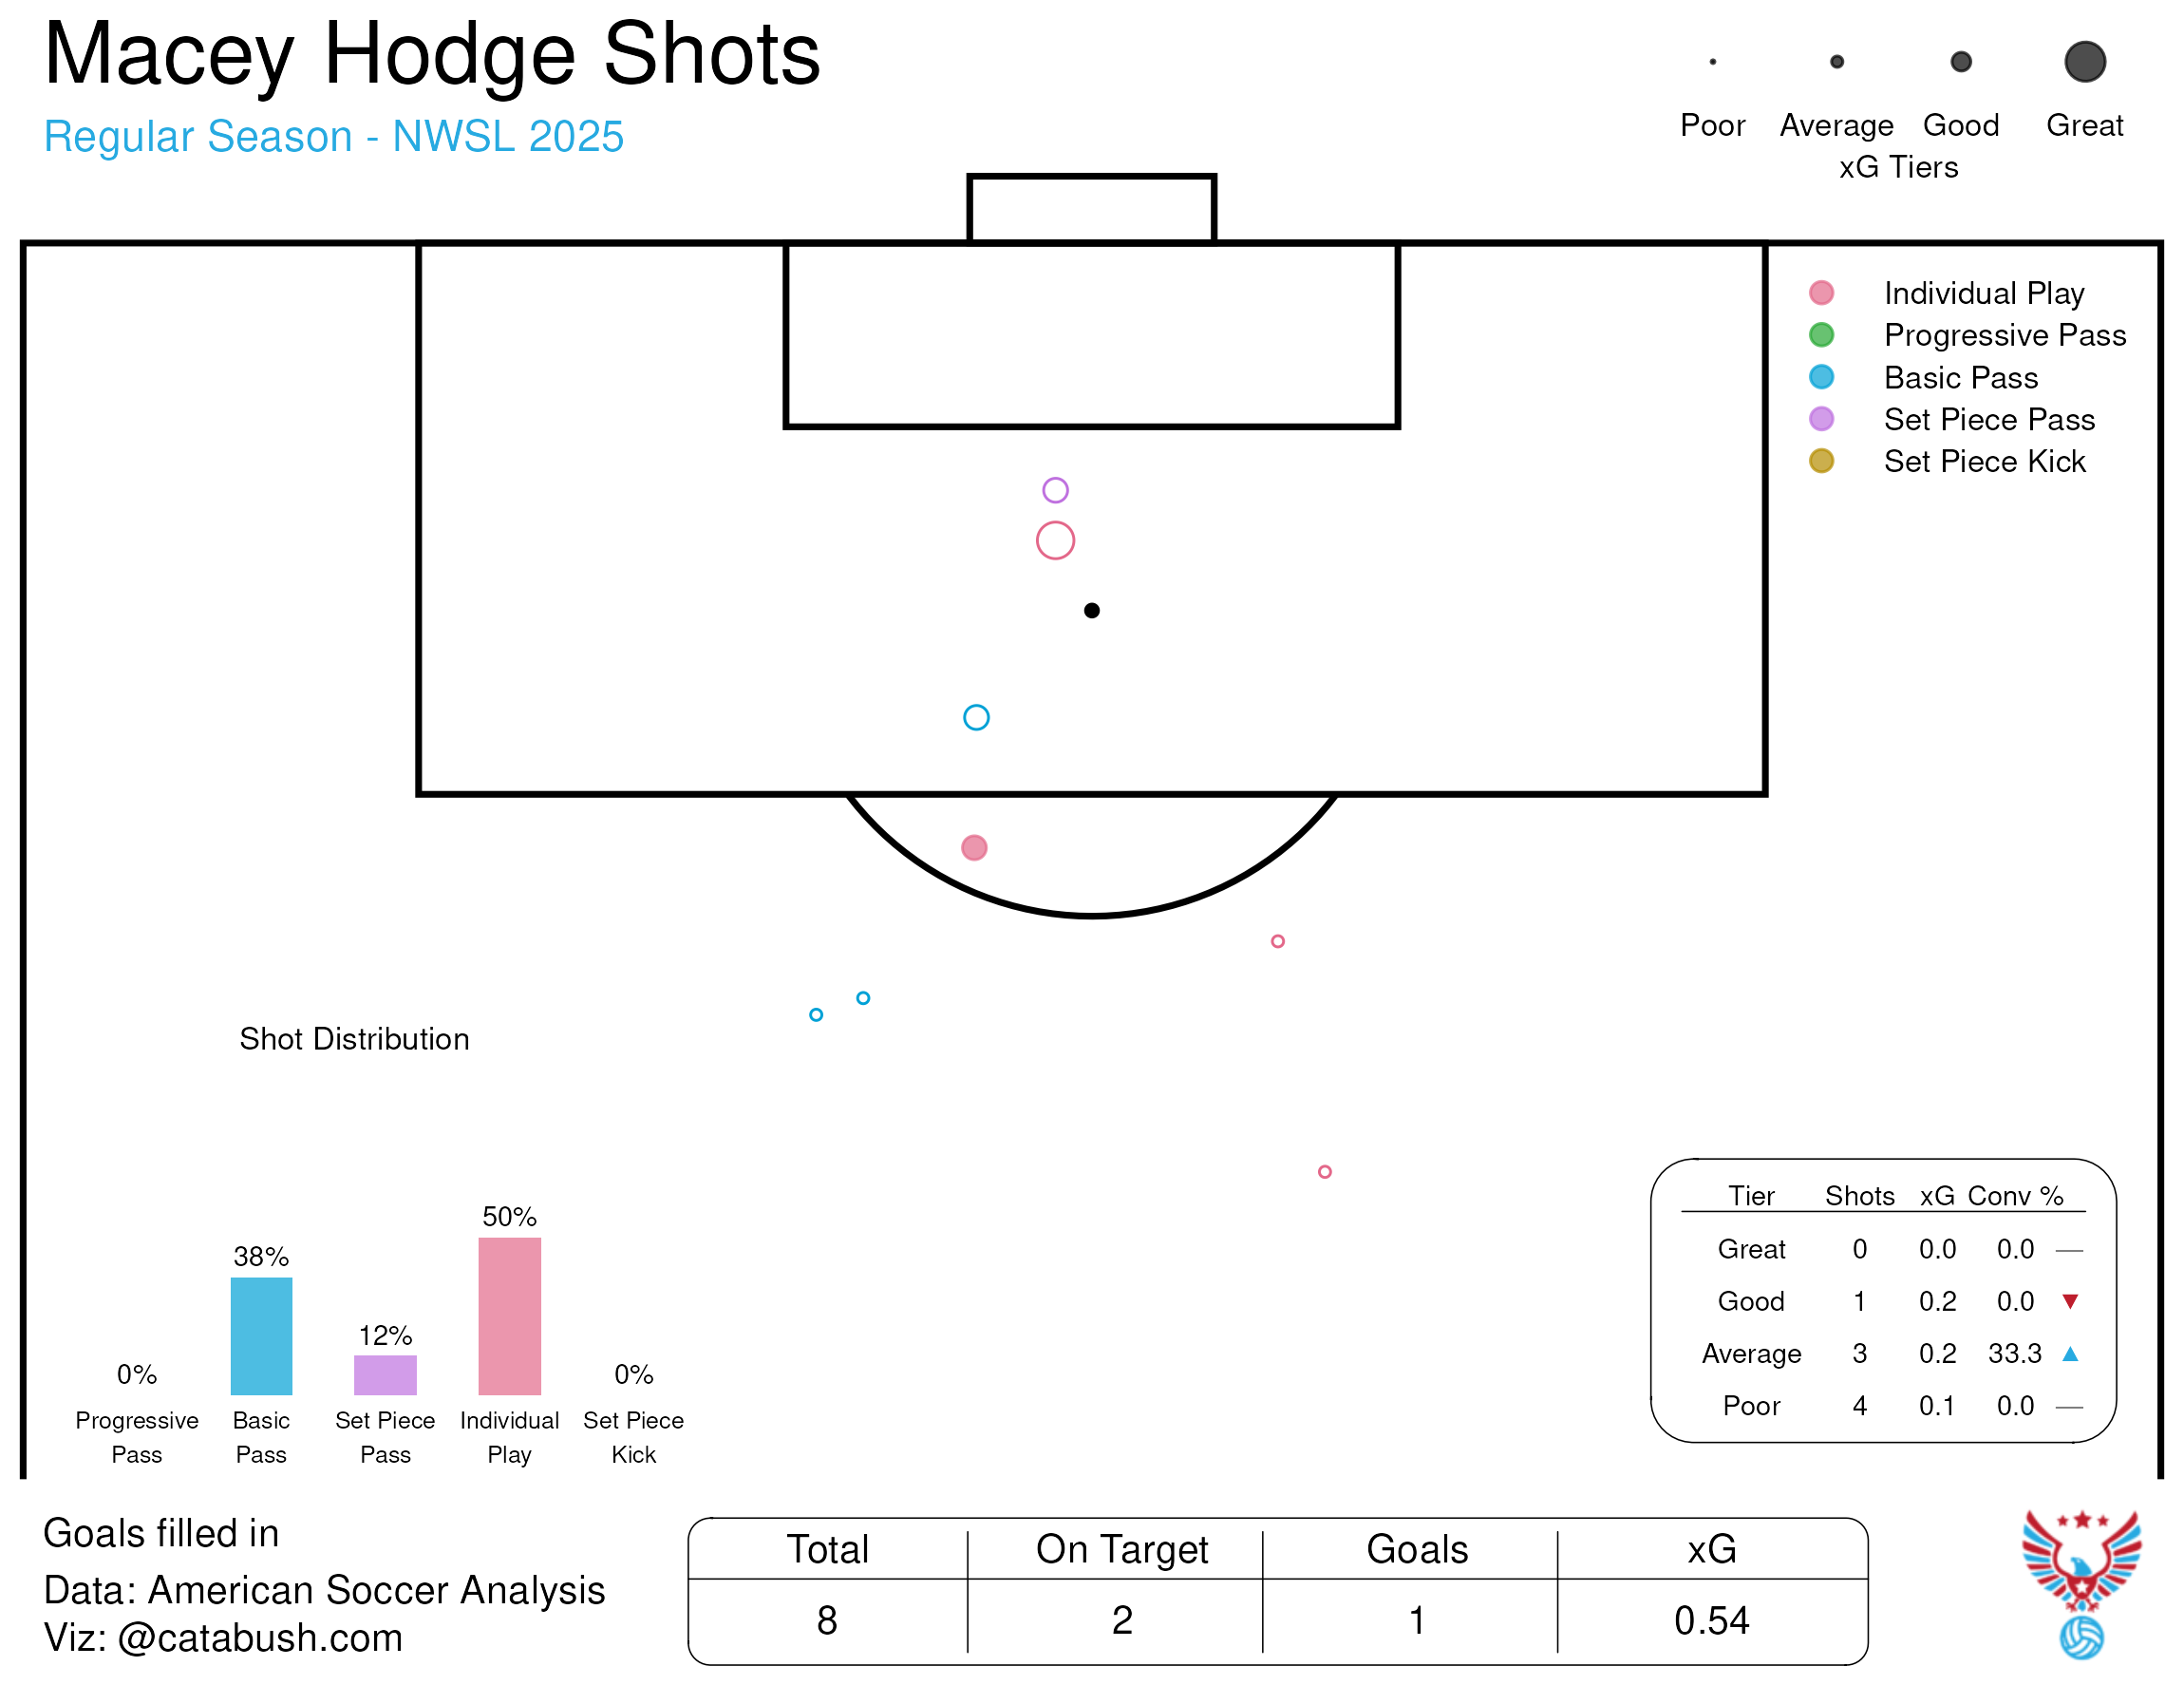
Hodge had 1 Goal and 0 Assists from 0.8 xG, 0.1 xAG, and 0.2 xA. Focusing on the shooting first, Hodge had 8 Shots, with 2 On Target, averaging 0.1 xG per Shot. Her lone goal, which was against the Dash, was a well-taken, low shot to the corner from right at the edge of the box after a block. However, I think that the Houston defense really fell asleep on this play, with nobody coming out to challenge Hodge and nobody tracking her in from the midfield either. Good technique on the shot, but defenses are not usually going to give you that much time. ASA ranked her goal as only an Average Shot. She had 1 Good Shot, 2 other Average Shots, and 4 Poor Shots, all of which were from outside the box.
Playmaking-wise, Hodge offered very little. She only had 2 Key Passes or 0.24 per 90 (6th percentile). Her xAG and xA were 4th and 6th percentile respectively. With only 1 Pass into the Penalty Area, it’s not surprising that she had so few Key Passes. Widening the scope a little more to include Shot Creating Actions, Hodge has 11, or 1.31 per 90 (10th percentile). Even among Defensive Midfielders, this is very low, with only 3 players in this group having fewer SCAs. This is to be expected, I think. Passing isn’t playmaking, but I don’t think that you can be a good playmaker without strong passing skills.
Defensive Contribution
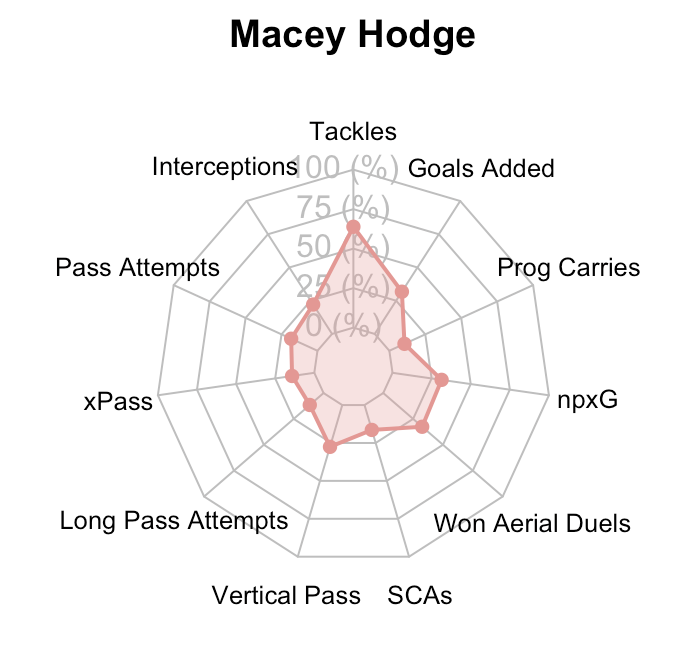
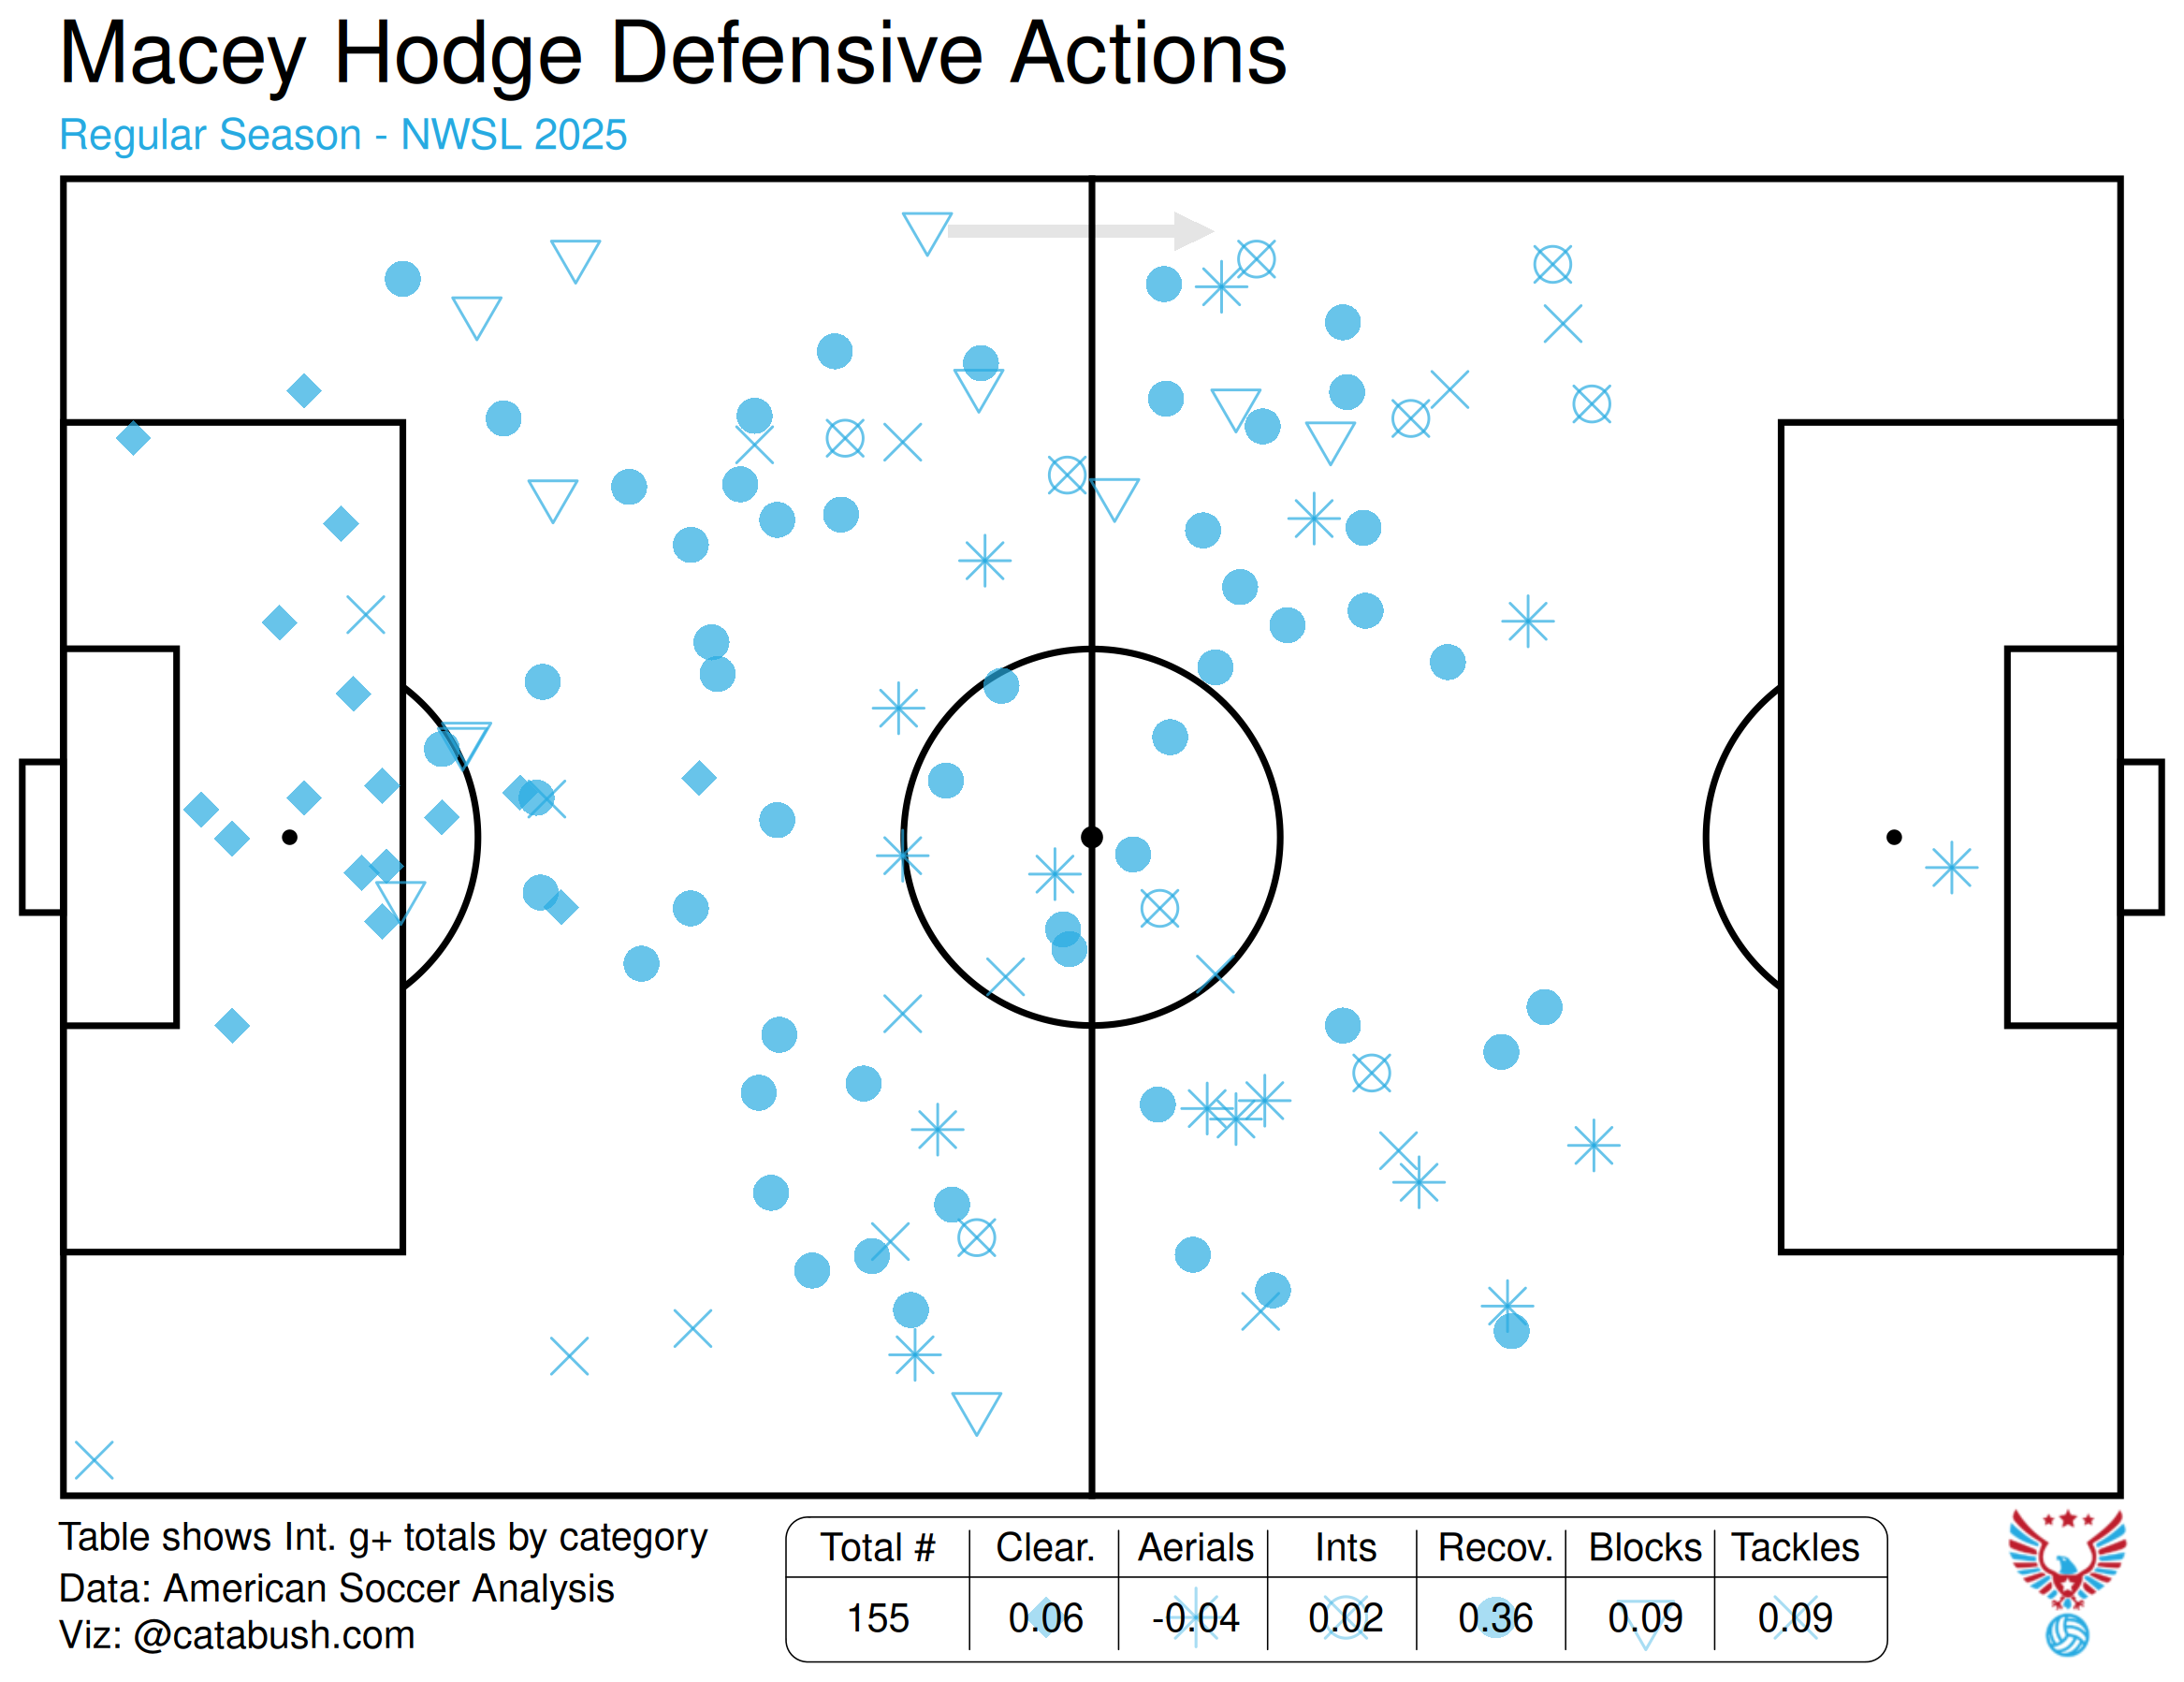
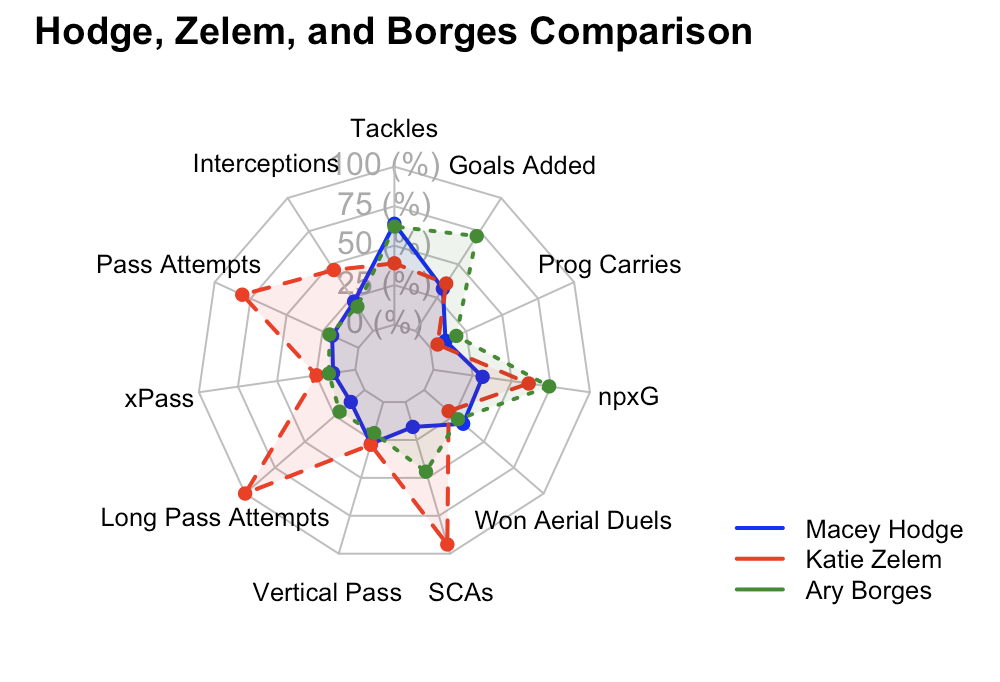
This is the area in which Hodge stands out, especially with Tackles, as can be distinctly seen on her radar plot. She averaged 3.21 Tackles per 90 (87th percentile). Sam Laity even highlighted this, saying that her ball-winning ability is one of the best he’s seen. This is undoubtedly Hodge’s greatest strength, however, I have an issue with this as well. Hodge is very aggressive in hunting down the ball, but this can work against her, as there are definitely occasions where she gets dragged out of position when she does this. There is not publicly available data to show if a player is out of position, but you can see in the chart below that almost none of Hodge’s Tackles (marked as an X) happen in the center channel. More often than not, she is chasing a ball carrier towards the wings. If they are able to find a pass before she reaches them, the opposition will find a large gap that Hodge has left open. This is not the case with other noted Tacklers, such as Flint or Meza. I wouldn’t be surprised if Hodge shined more in this regard in practice, which is why Laity kept starting her. In half-pitch games, or 7v7s, I can imagine that Hodge is tackling everything in sight, as the smaller space means players can’t dribble away. On a full sized pitch, though, I think that Hodge was sacrificing defensive shape in order to hunt the ball, and ultimately, that hurt Angel City.
In her other Defensive stats, Hodge had 1.43 Blocks (71st percentile), and 0.95 Interceptions (53rd percentile). She had a 53.3% win rate for Aerial Duels (67th percentile), winning 1.90 (91st percentile). All of these are very good, but somewhat surprisingly, she only gets a +0.01 for Interrupting on her g+ score. I would have thought that the cumulative effect of all of her defensive work would add up to more, as she does get involved all over the pitch. All stats are per 90.
And again, to provide my contrast with Zelem, Hodge’s total Tackles + Interceptions, or how often she won the ball back, was 4.17. Zelem had 3.85. In essence, Hodge was getting one more tackle or interception every three complete games. Zelem’s g+ score for Interrupting was -0.16. So while Hodge is the superior defensive player, and by a statistically significant amount, but not, perhaps, a substantial amount.
Discipline
I have usually just included cards and fouls as a part of defensive work, but a separate section does need to be included for Hodge. Her 6 Yellow Cards not only led ACFC, but she was also tied for third among all NWSL players. However, all of the players equal to or above her in this stat played at least twice as many minutes as Hodge. She averages 0.71 Yellow Cards per 90, while the second highest mark in the league is Taylor Flint with 0.44. This is such a dramatic difference it requires it’s own graph.
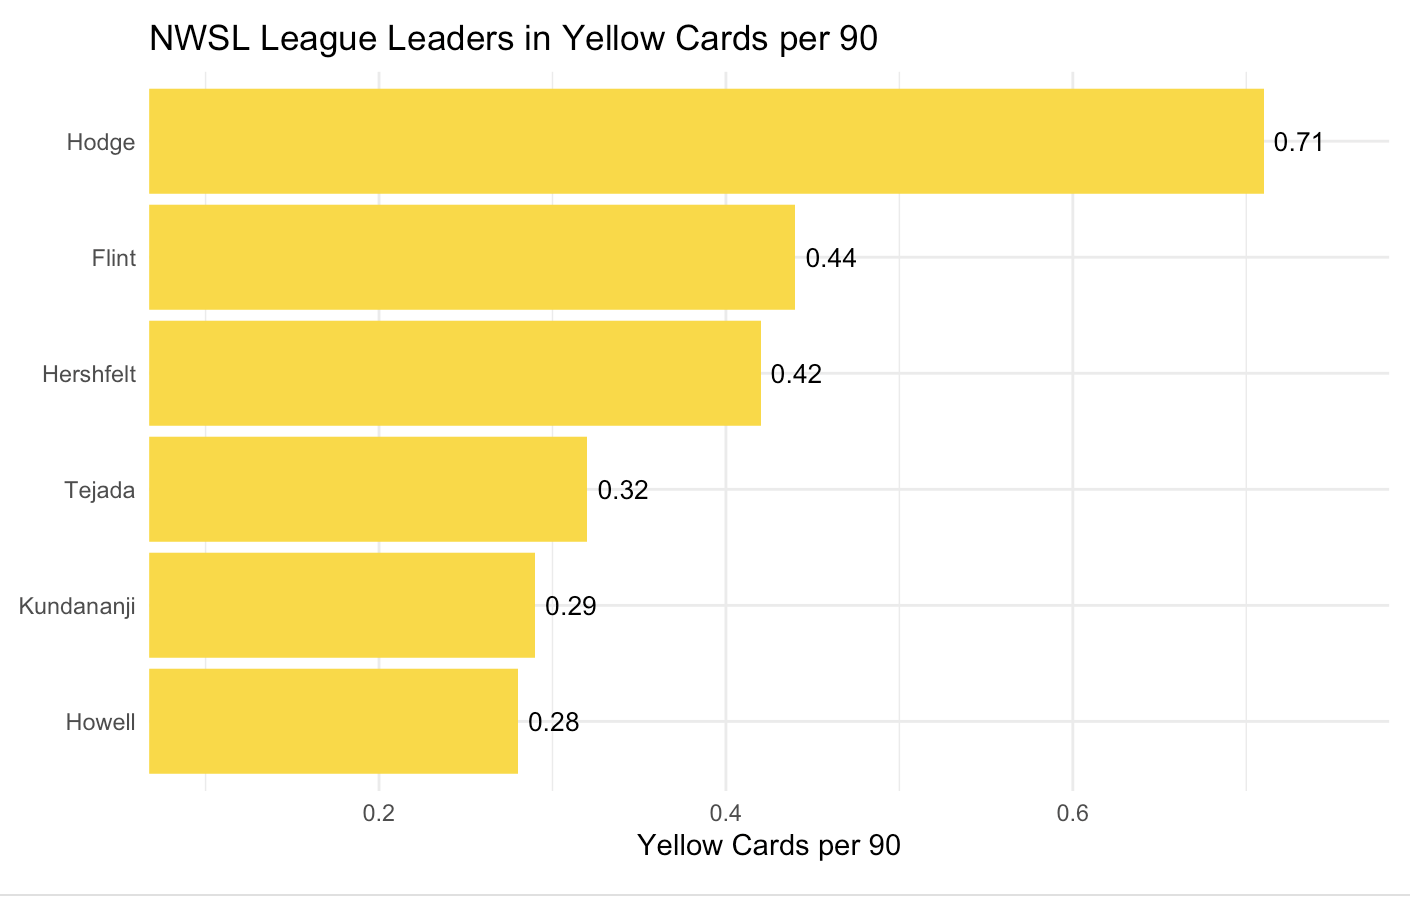
Hodge doesn’t just lead this category, she takes it by a staggering distance. To her credit, she never got a red or a second yellow, but I think this may be because she almost never finished matches. She only had two 90 minute games, and averaged 68 minutes per start.
Hodge’s actual number of Fouls is not that great. She only had 17 on the season, or 2.02 Fouls per 90. For comparison, Hammond was at 1.52 Fouls per 90, while of the players in the chart above, Kundananji was equal to Hodge with 2.02, while Hershfelt was just below at 1.97. The lowest of that group is Howell with 1.61. So while Hodge commits a number of fouls, it’s still somewhat in keeping with her peers. That many extra Yellow Cards is representative of Hodge making rash tackles, not just having physical play. Hodge also drew 11 Fouls (1.31 per 90). which is a decent rate, right in the middle of the pack among her fellow Yellow Card leaders. But a -6 differential on Fouls Committed v Drawn is a negative, and it is not a surprise to see that the Fouling portion of Hodge’s g+ score is a -0.24 (8th percentile).
Possession
Hodge only had 4.5% of her team’s Touches (18th percentile), though this is definitely impacted by her lack of complete games. Clearly Hodge’s role was a defensive one, but this is where the Receiving statistics are particularly valuable, I think. While her defensive work necessitates the opponent having the ball, Receiving necessitates a pass from a teammate, so we can isolate a player’s contribution in the build-up. Hodge had 0.35 Progressive Passes Received (2nd percentile). Only receiving 1 Progressive Pass every three complete matches (or 4 based on Hodge’s average playing time), and especially as Hodge was not playing Progressive Passes herself, means that Angel City was not able to build through Hodge in any form. The Receiving score for her g+ was slightly better, at -0.23 (which was 61st percentile).
Hodge’s dribbling contribution was limited. She had 15.36 Carries (2nd percentile) and 0.48 Progressive Carries (26th percentile), although ASA only credits her with 1. Looking at the chart below, the pattern seems to be more about escaping pressure, with only a short distance for each Carry. This is not to say that Hodge would shy away from challenges; she averaged almost a Take-On per 90 (0.95, 48th percentile). This particularly stands out because of her limited number of carries.
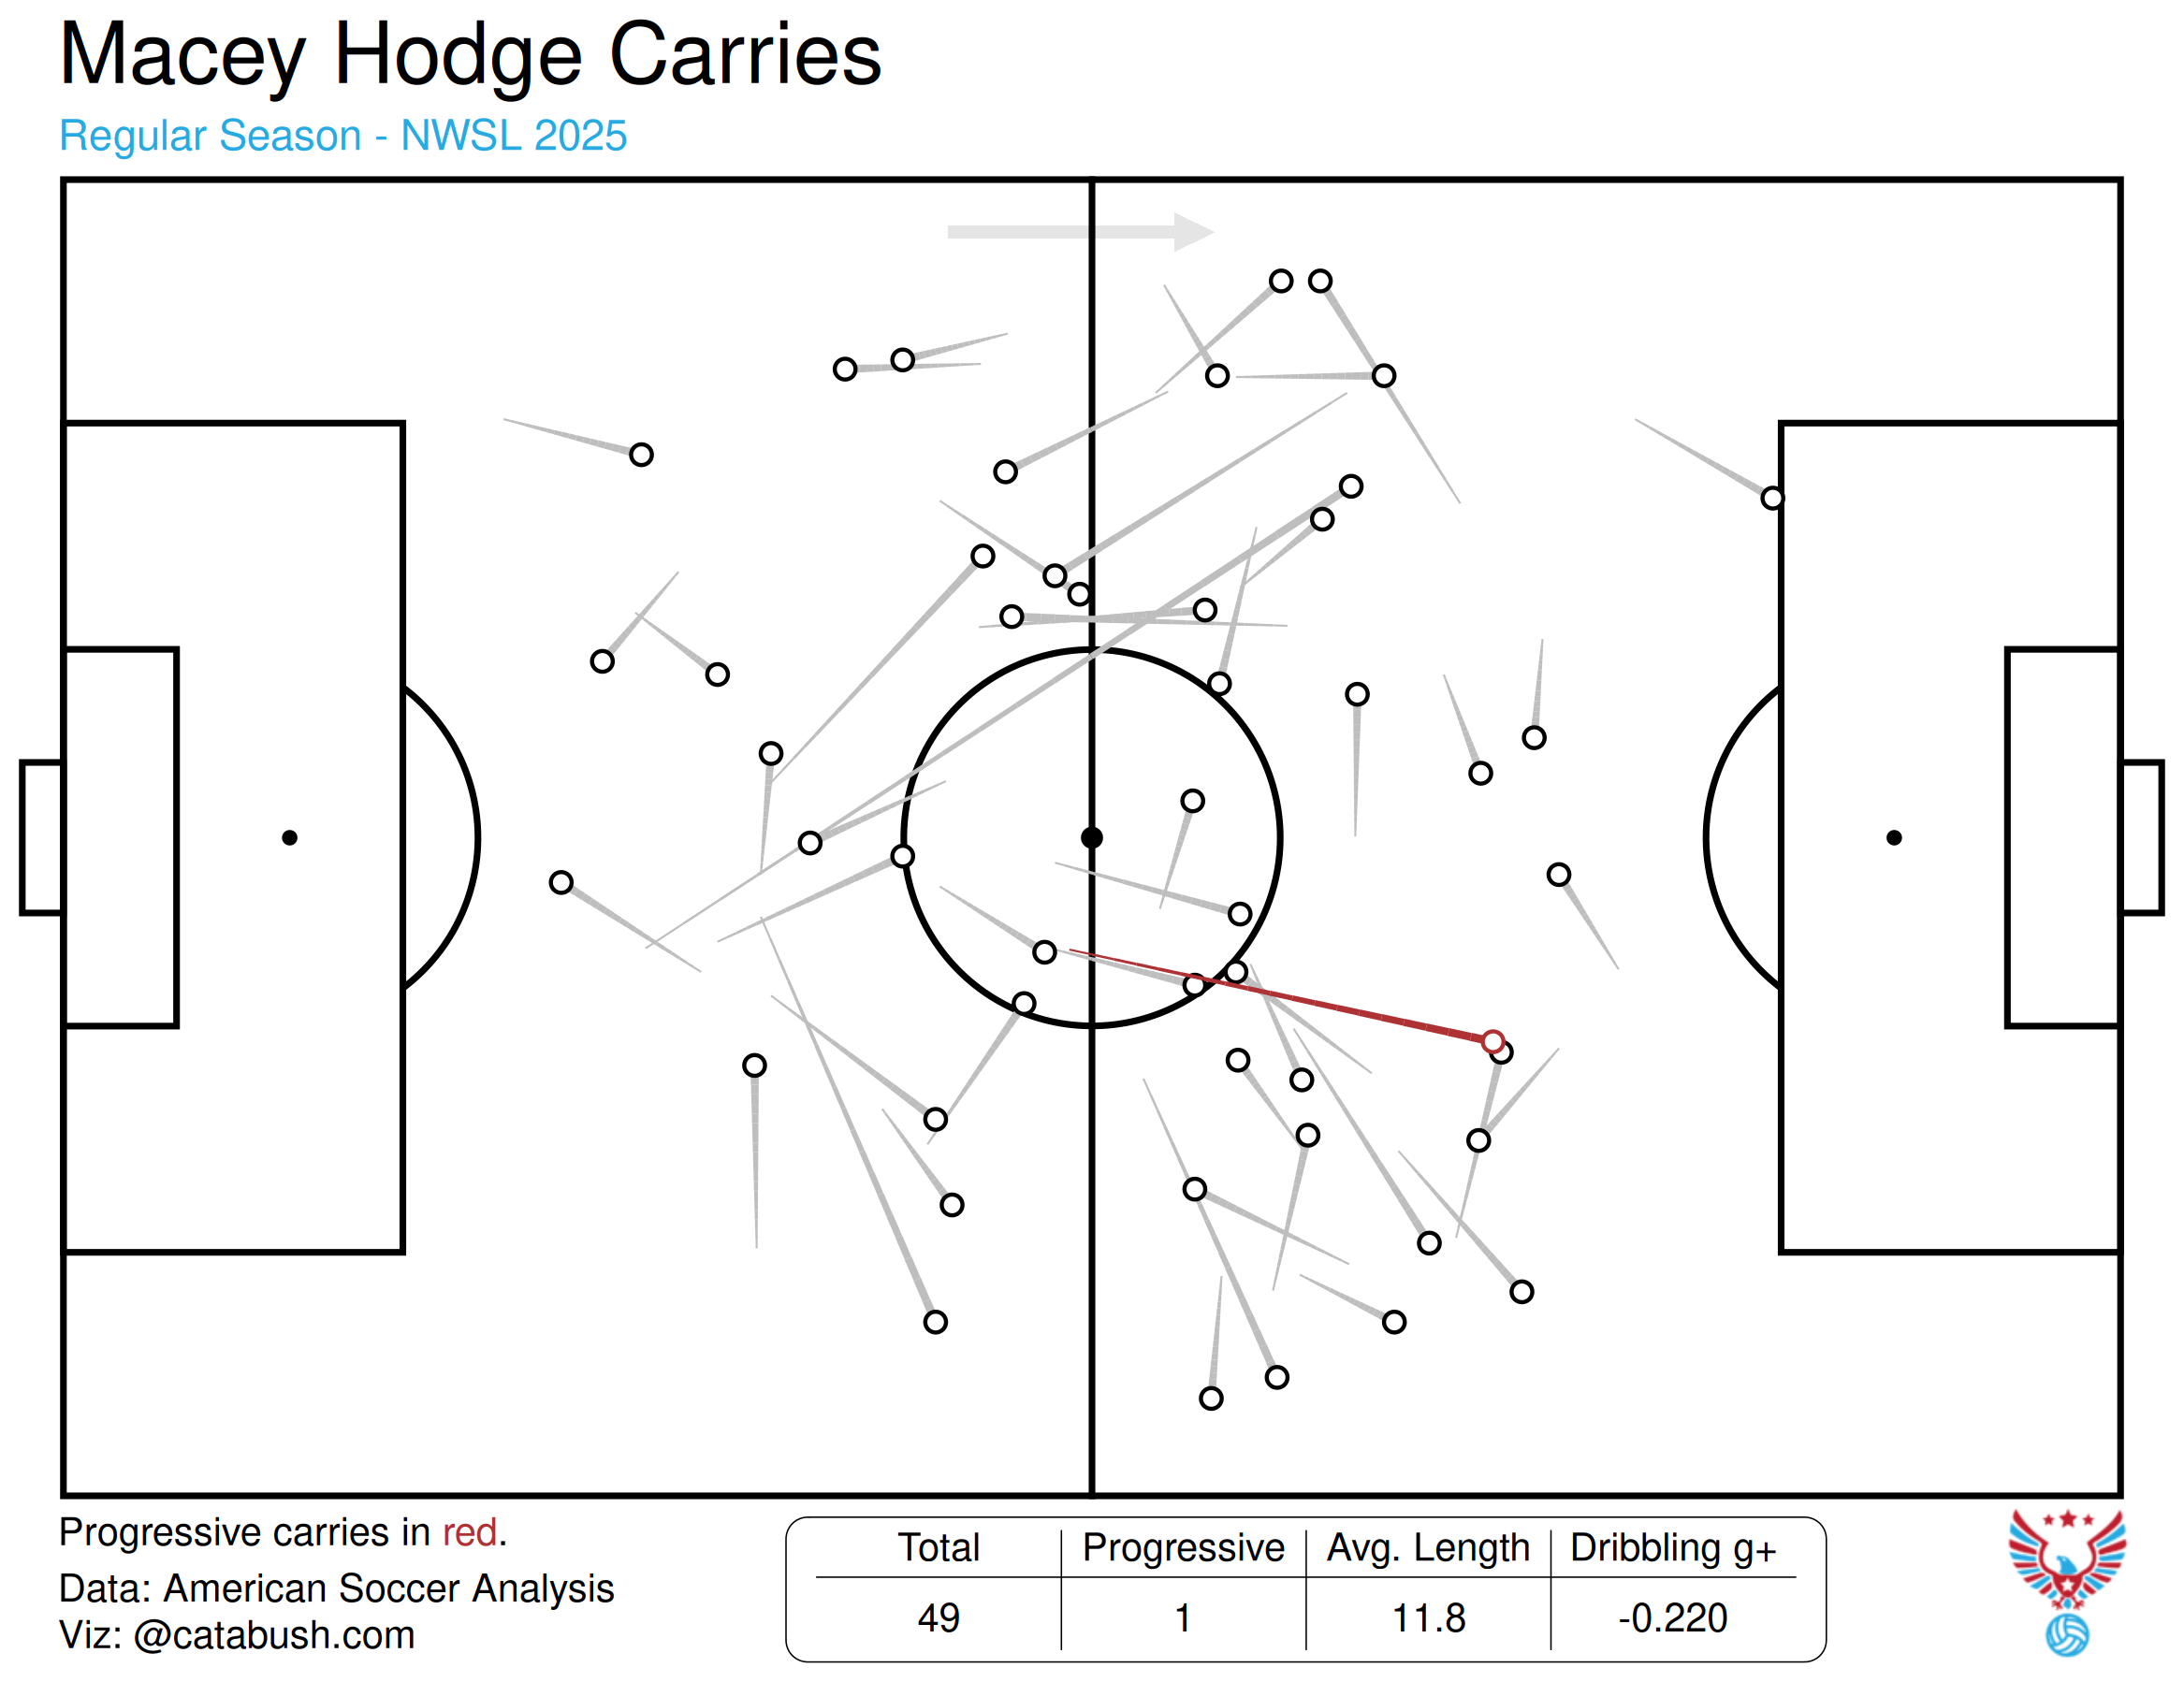
Hodge’s Dribbling g+ score was -0.2 (28th percentile). This never stood out as prominent part of her game, but I always thought that she did seem composed on the ball when she had it. The higher percentiles in Progressive Carries and her g+ over her Total Carries show that she did make the most of her limited number amount of dribbling.
Conclusion
Hodge was traded during the offseason to Racing Louisville for a total of $83,000 ($28,000 in Allocation money) and an International Spot for 2 years. I think that Louisville is a good spot for her. In a sense, she’s taking over the spot that Borges left to come to Angel City. Borges is an all around better player, and was signed as a free agent, so I think that this is good business by Angel City.
Despite the fact that my analysis of Hodge is largely negative, I do think that she has potential. My biggest issue, actually, is how much playing time she received, and that was due to the coaching staff. To me, there is absolutely nothing wrong with a rookie player only having a role off the bench in her first year. I believe that Hodge has a future in the NWSL, but if I were scouting her, I would recommend following up in another year. I believe that she needs to polish her passing, be more positionally aware, and make better decisions in her tackling, and the test would be to see how she is improving in that regard. She is a strong, natural tackler and I believe that she could be a good Destroyer on the right team. Her Total g+ score was a -1.00 (26th percentile). For me, she primarily needs to find a way to add value when her team is in possession, whether that is with her passing, or being able to receive the ball under pressure and turn upfield. I think that her defensive instincts will naturally evolve with more time in the league. As Louisville had the least possession and were third in both yellow cards and fouls, I think that Hodge will fit in well there. I am interested to see what progress she does make.
As an interesting comparison, I created a radar plot that includes Hodge, Zelem (as the player most directly competing with Hodge at the start of the season), and Borges (as the player likely stepping into this role for 2026).
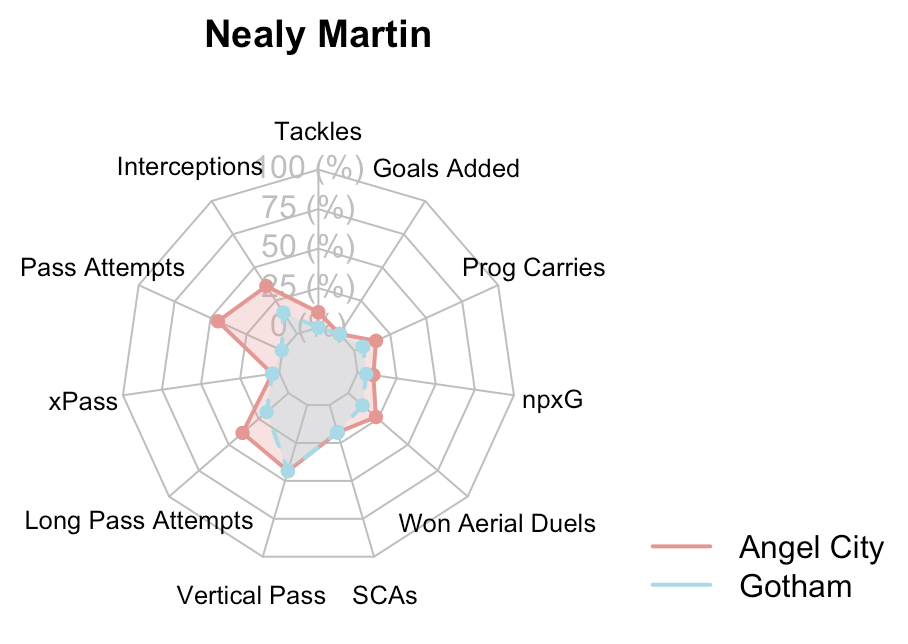
Note: The data that I gathered from FB Ref differentiates between stats from each team, while my data from ASA looks at the season in it’s entirety, so on the radar plots for Martin and Sugita, the plots will be the same for Vertical Pass, xPass, and Goals Added.
I have always viewed Martin as a utility player, and quite possibly as the best in the NWSL, with her appearances as a goalkeeper being the ultimate exclamation point for that statement. In my unsupervised clustering, Martin was classified as a Defensive Midfielder at Gotham, but as a Deep Lying Playmaker at Angel City. I think that the way to think of her is just as an all-around midfielder. She had 1,060 minutes for Gotham from 16 matches, and 585 minutes from 7 matches with Angel City. After coming on at halftime in her first appearance for ACFC, Martin had 6 consecutive Starts in which she played the full 90 minutes.
Passing
Martin took on a much larger passing role with Angel City, though part of that is that she was playing multiple games as a defender for Gotham. Her overall numbers, however, are not that of an elite playmaker. Her season Pass Completion Percentage (76.5) is only in the 55th percentile, and you’d expect that her games at centerback, especially, would give that number a little bit of a boost. Her worst statistic is her xPass score (-17.88) is only in the 4th percentile. Broken down by team, Martin’s xPass per 90 was -2.79 with Gotham, and while it improved to -0.62 with Angel City, of course, that is still negative. It should be noted that this is a big change from last year, when Martin posted a +16.65. This may be reflective of Gotham overall playing much better in 2024 (until, of course, the playoffs in 2025). Her Vertical Passing was similar for both, though, with 4.8 Yards for Angel City and 4.74 yards for Gotham. It seems that a big piece of her passing was laterally, as we can see in the pass chart below. There’s some good progressive work in the final third, but very little in the middle or defensive thirds.
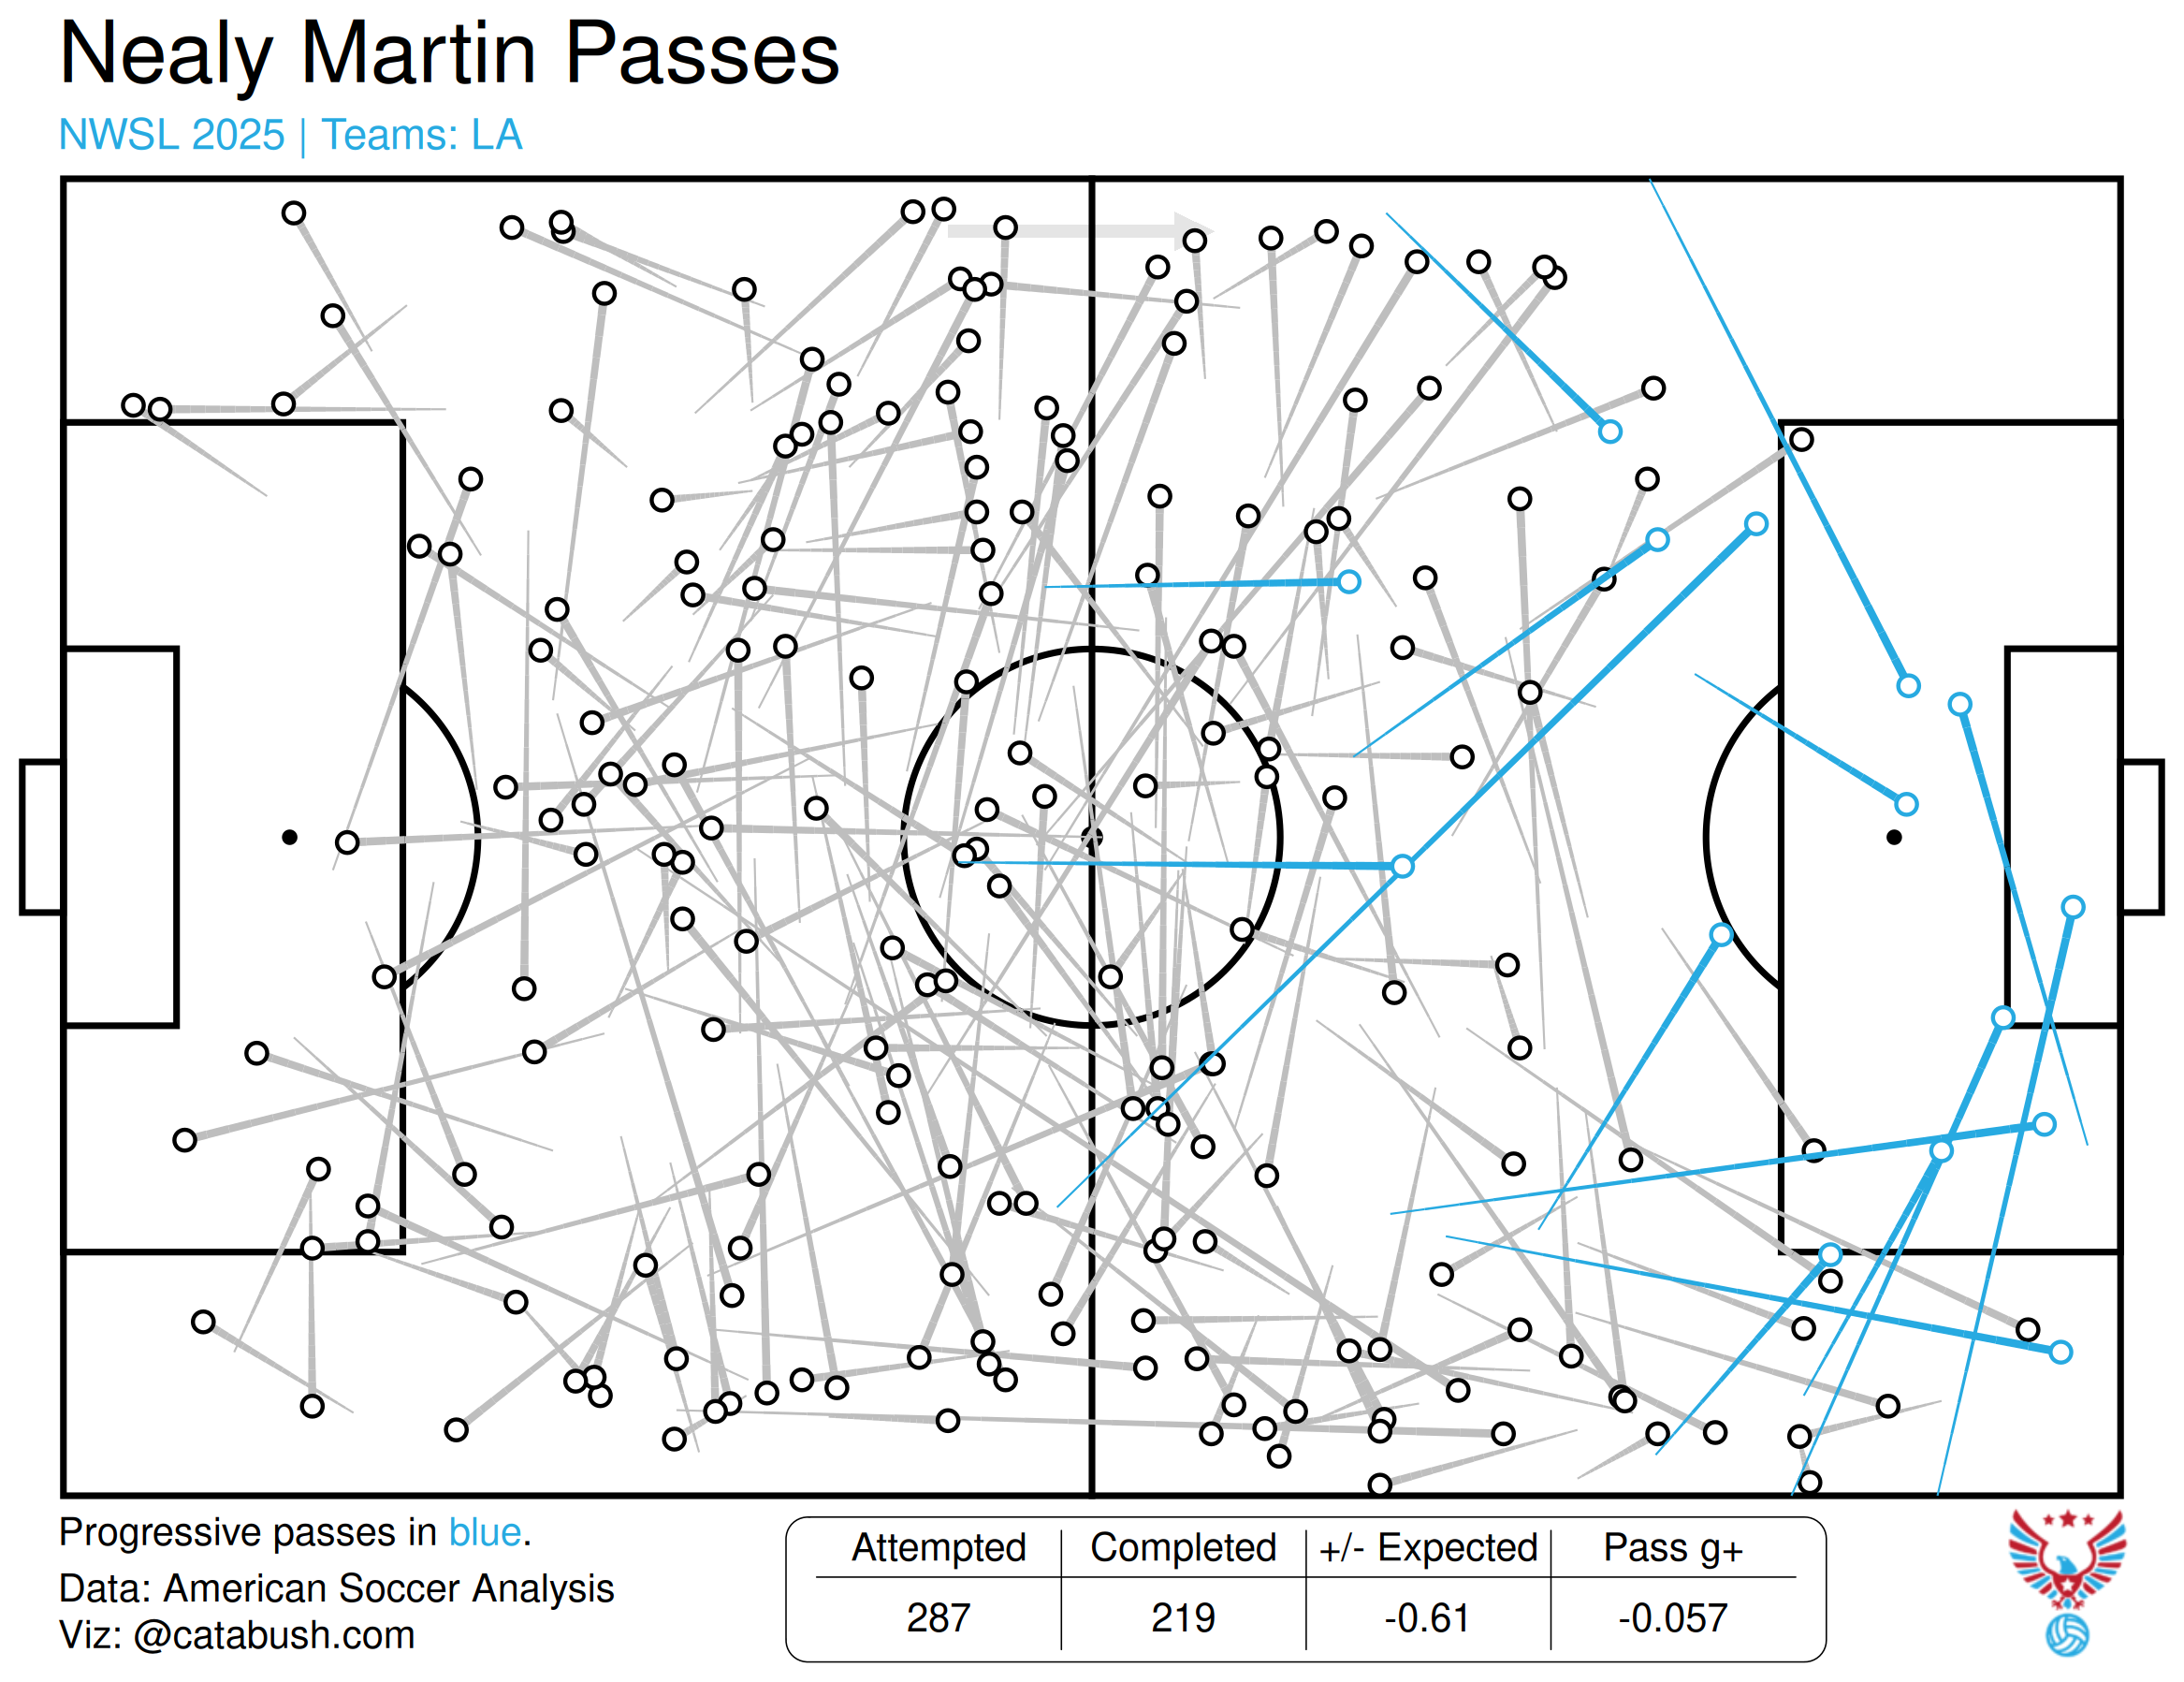
The Passing section of her g+ score was -0.12 for Angel City and -0.17 for Gotham. That cumulative -0.3 puts Martin in the 12th percentile. In 2024, Martin’s Passing g+ was -0.01, so while this is better than 2025, she was still only 33rd among CMs and DMs, and this is in spite of her much better xPass score.
Offensive Contribution
I’d like to continue from the passing section first, before getting into actual goal contributions or shots. As I pointed out, Martin has some decent passing in the Attacking Third. Her 0.61 Passes into the Penalty Area was the 46th percentile, and also middle of the pack for other Deep Lying Playmakers. This didn’t really translate even into Shots, however. Her 1.38 SCAs per 90 was only 12th percentile, and she only had 0.46 Key Passes (16th percentile). That only equals 3 Key Passes, though we have to acknowledge the smaller sample size of Martin’s time at Angel City. She did have decent numbers from those 3 Key Passes, with 0.07 xAG per 90 (44th percentile) and 0.06 xA per 90 (38th percentile). She finished with 1 Assist from that with Angel City, and also had an Assist with Gotham. We’d expect a straightforward correlation between all of these: more Shot Creating Actions leads to more Key Passes which leads to higher xA which leads to more actual Assists. With Martin, though her SCAs don’t provide Key Passes comparable to her peers, but she does seem to make the most of those. Only 5 Angel City players had more Assists, and only 4 had more Assists per 90. Again, sample size is a concern, and Martin only had 1 Assist prior to this season for the historical perspective. I don’t think that we can say that playmaking is a consistent part of Martin’s game, but there is something intriguing in her numbers. The quality of some of those passes is superb, especially with her ability to deliver balls from wide positions. My sense is that if she were able to more consistently get passes into the box, we could consistently see this.
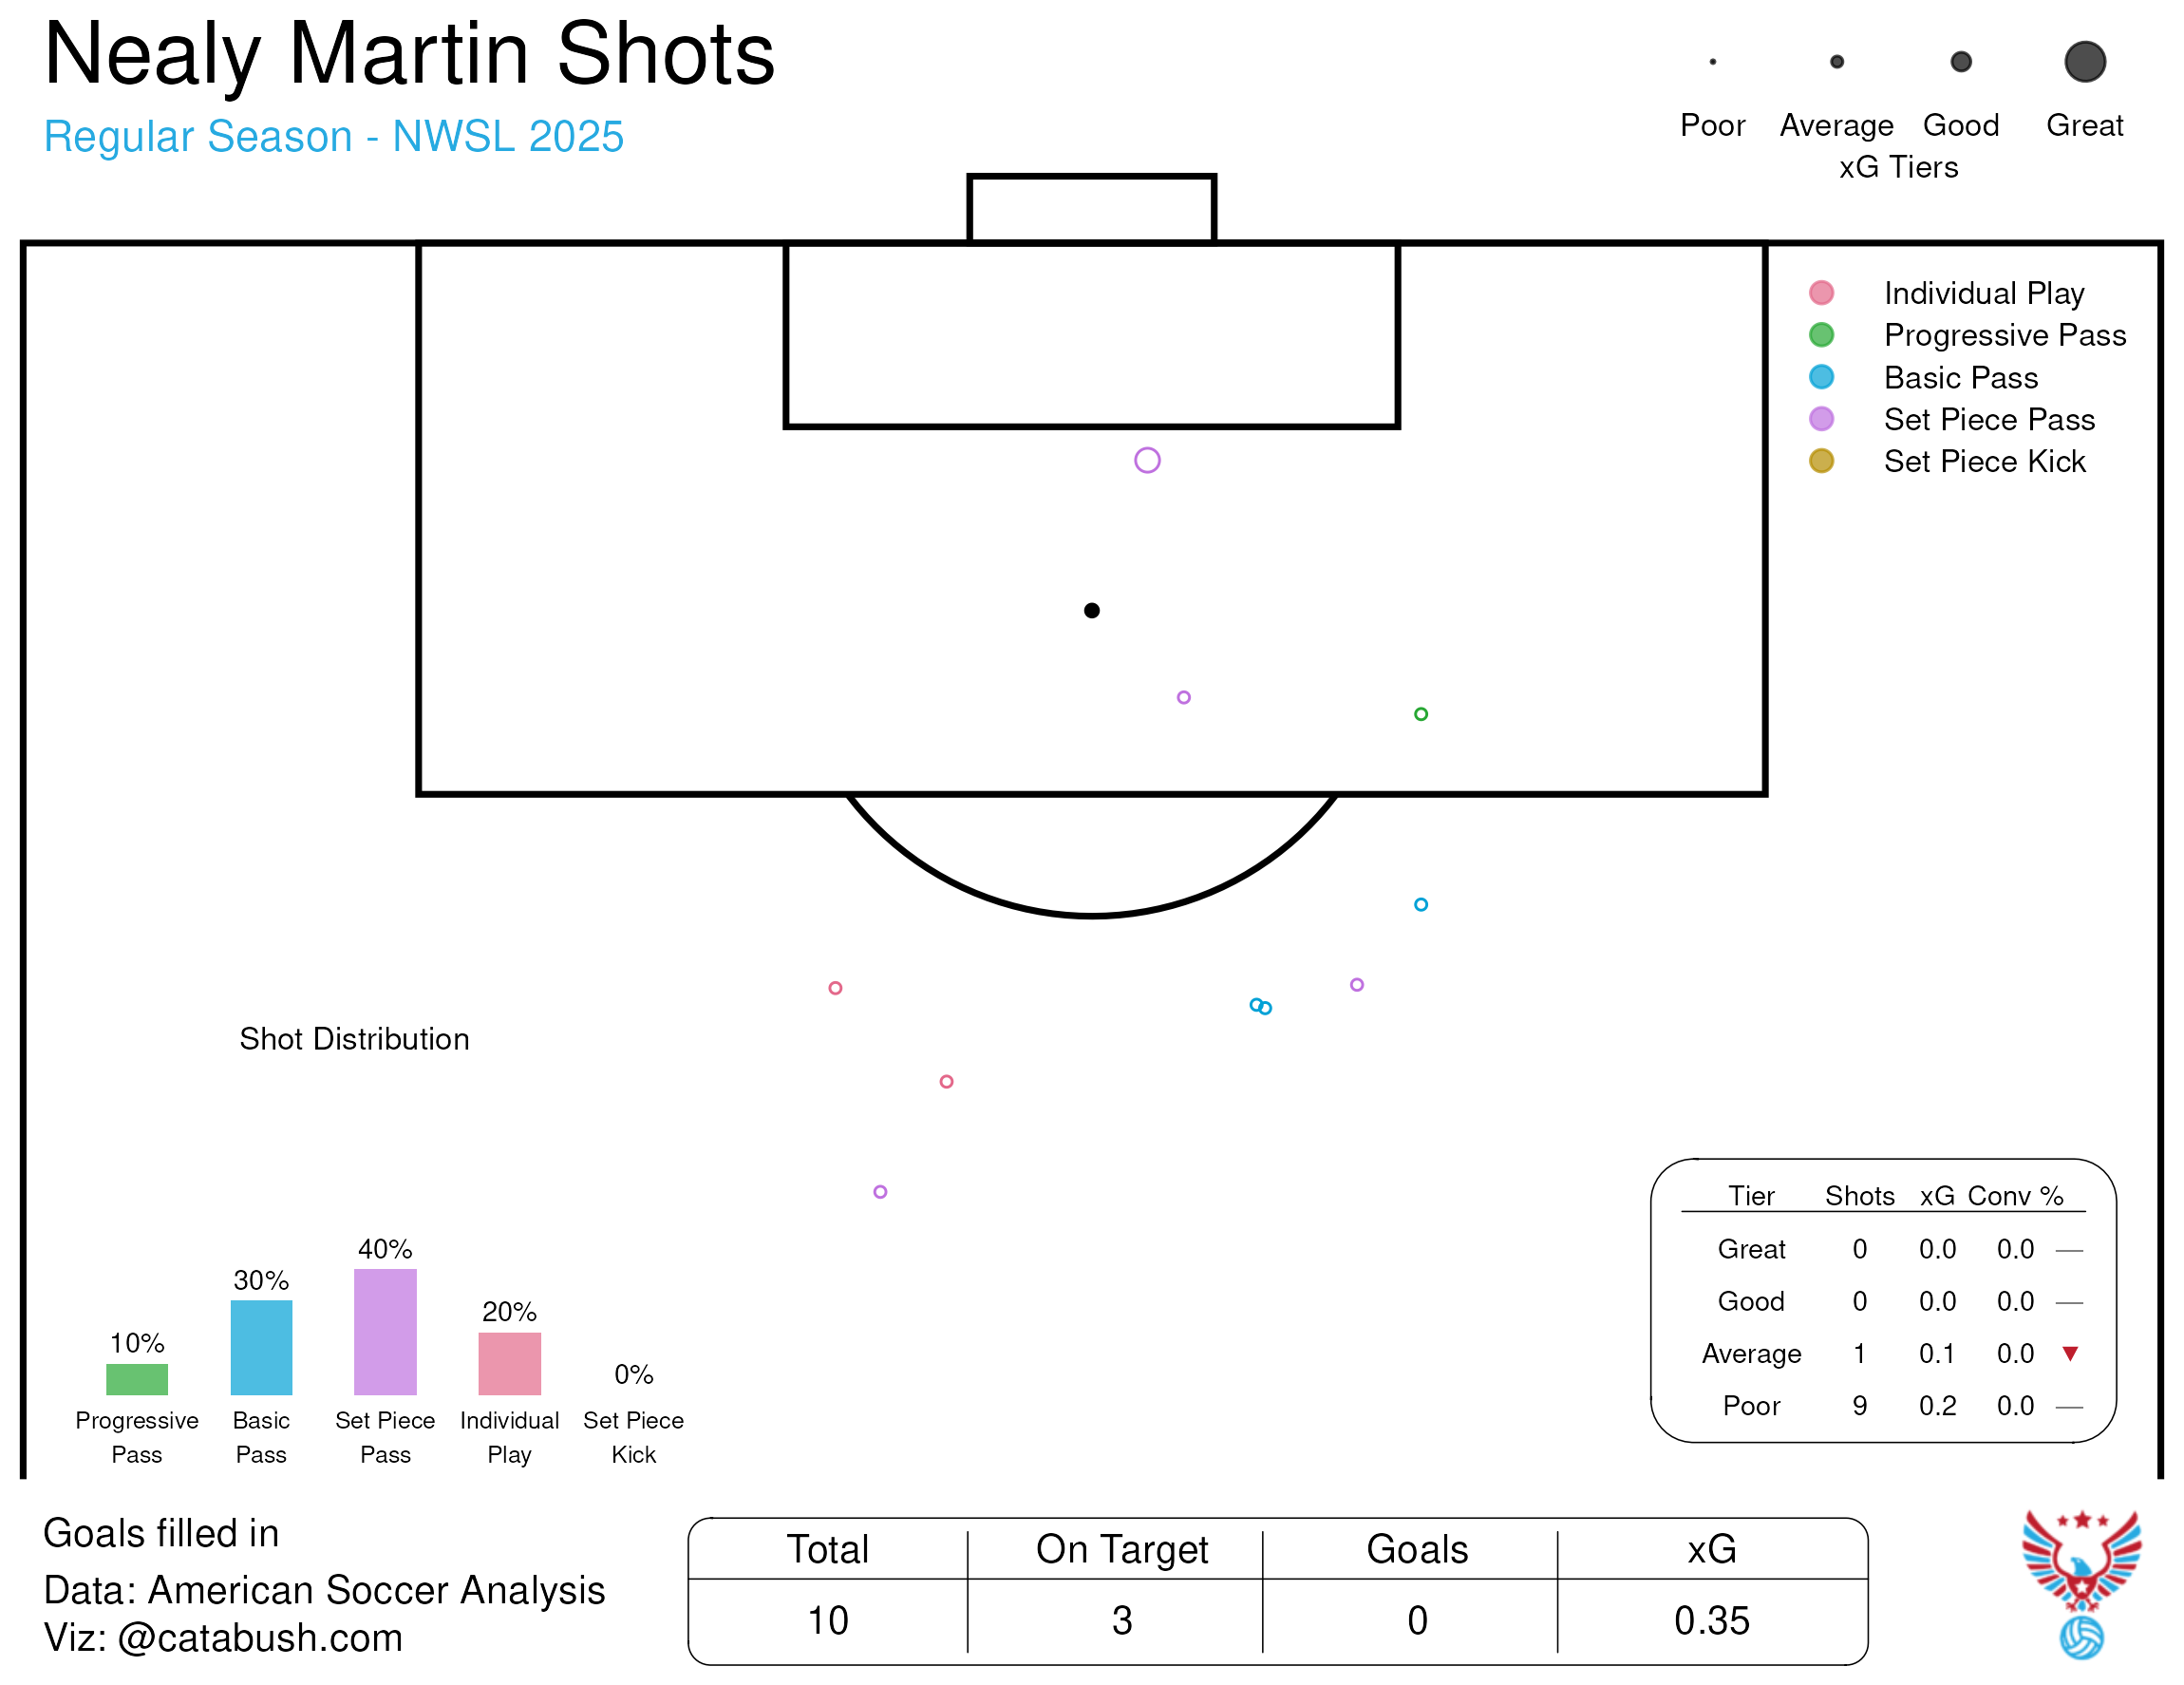
Martin has yet to score a goal in her six seasons in the NWSL. This could possibly change, based on her time at Angel City so far, where she posted career highs in Shots per 90 (0.62), Shots on Target per 90 (0.31), and tied her high in Shot on Target Percentage (50%). She was being tasked with more responsibility at Angel City, and that includes trying to score goals. The Shot Chart above includes both Gotham and Angel City, just to get a better sense. Of her 10 Shots last year, 9 were considered poor. Her total npxG was 0.35, and for the 4 Shots taken at Angel City, it was 0.12. I wouldn’t count on Martin to be scoring goals, but I also think that 2026 is going to be the year when she gets her first.
Defensive Contribution
Martin didn’t make a lot of Tackles, and in fact had the lowest Tackle rate among ACFC central midfielders (0.92, 4th percentile). This is perhaps a bit surprising given her reputation, and her rate at ACFC is down from her time at Gotham in 2025, although she was playing significant minutes as a defender there. Her Interception rate was much better (1.38, 69th percentile), but combined, her Tackles + Interception rate was still not quite out of the lowest quartile (2.31, 24th percentile).
Martin is known as a tough defensive player, but her numbers don’t back this, and this was also not the case of one bad year. Her Interrupting g+ score was -0.98, which was the worst score among central midfielders by some margin. Savannah McCaskill was the second worst with -0.51. In 2024, Martin also had the worst mark with -0.77 (Bea Franklin was the second worst with -0.45). In 2023, there were seven players with lower scores than Martin’s -0.18.
Martin’s Blocks (1.23, 53rd percentile), were average, and her Aerial Win Percentage (40.9%, 30th percentile) isn’t high. Martin is listed at 5’7”, but she does challenge for a lot of aerial duels, and her 1.38 Aerial Duels won per 90 was 87th percentile.
Martin does better with her fouling, having committed 9 Fouls and Drawn 7, while only receiving 1 Yellow Card. For her Fouling g+ score, Martin had a +0.01 (55th percentile).
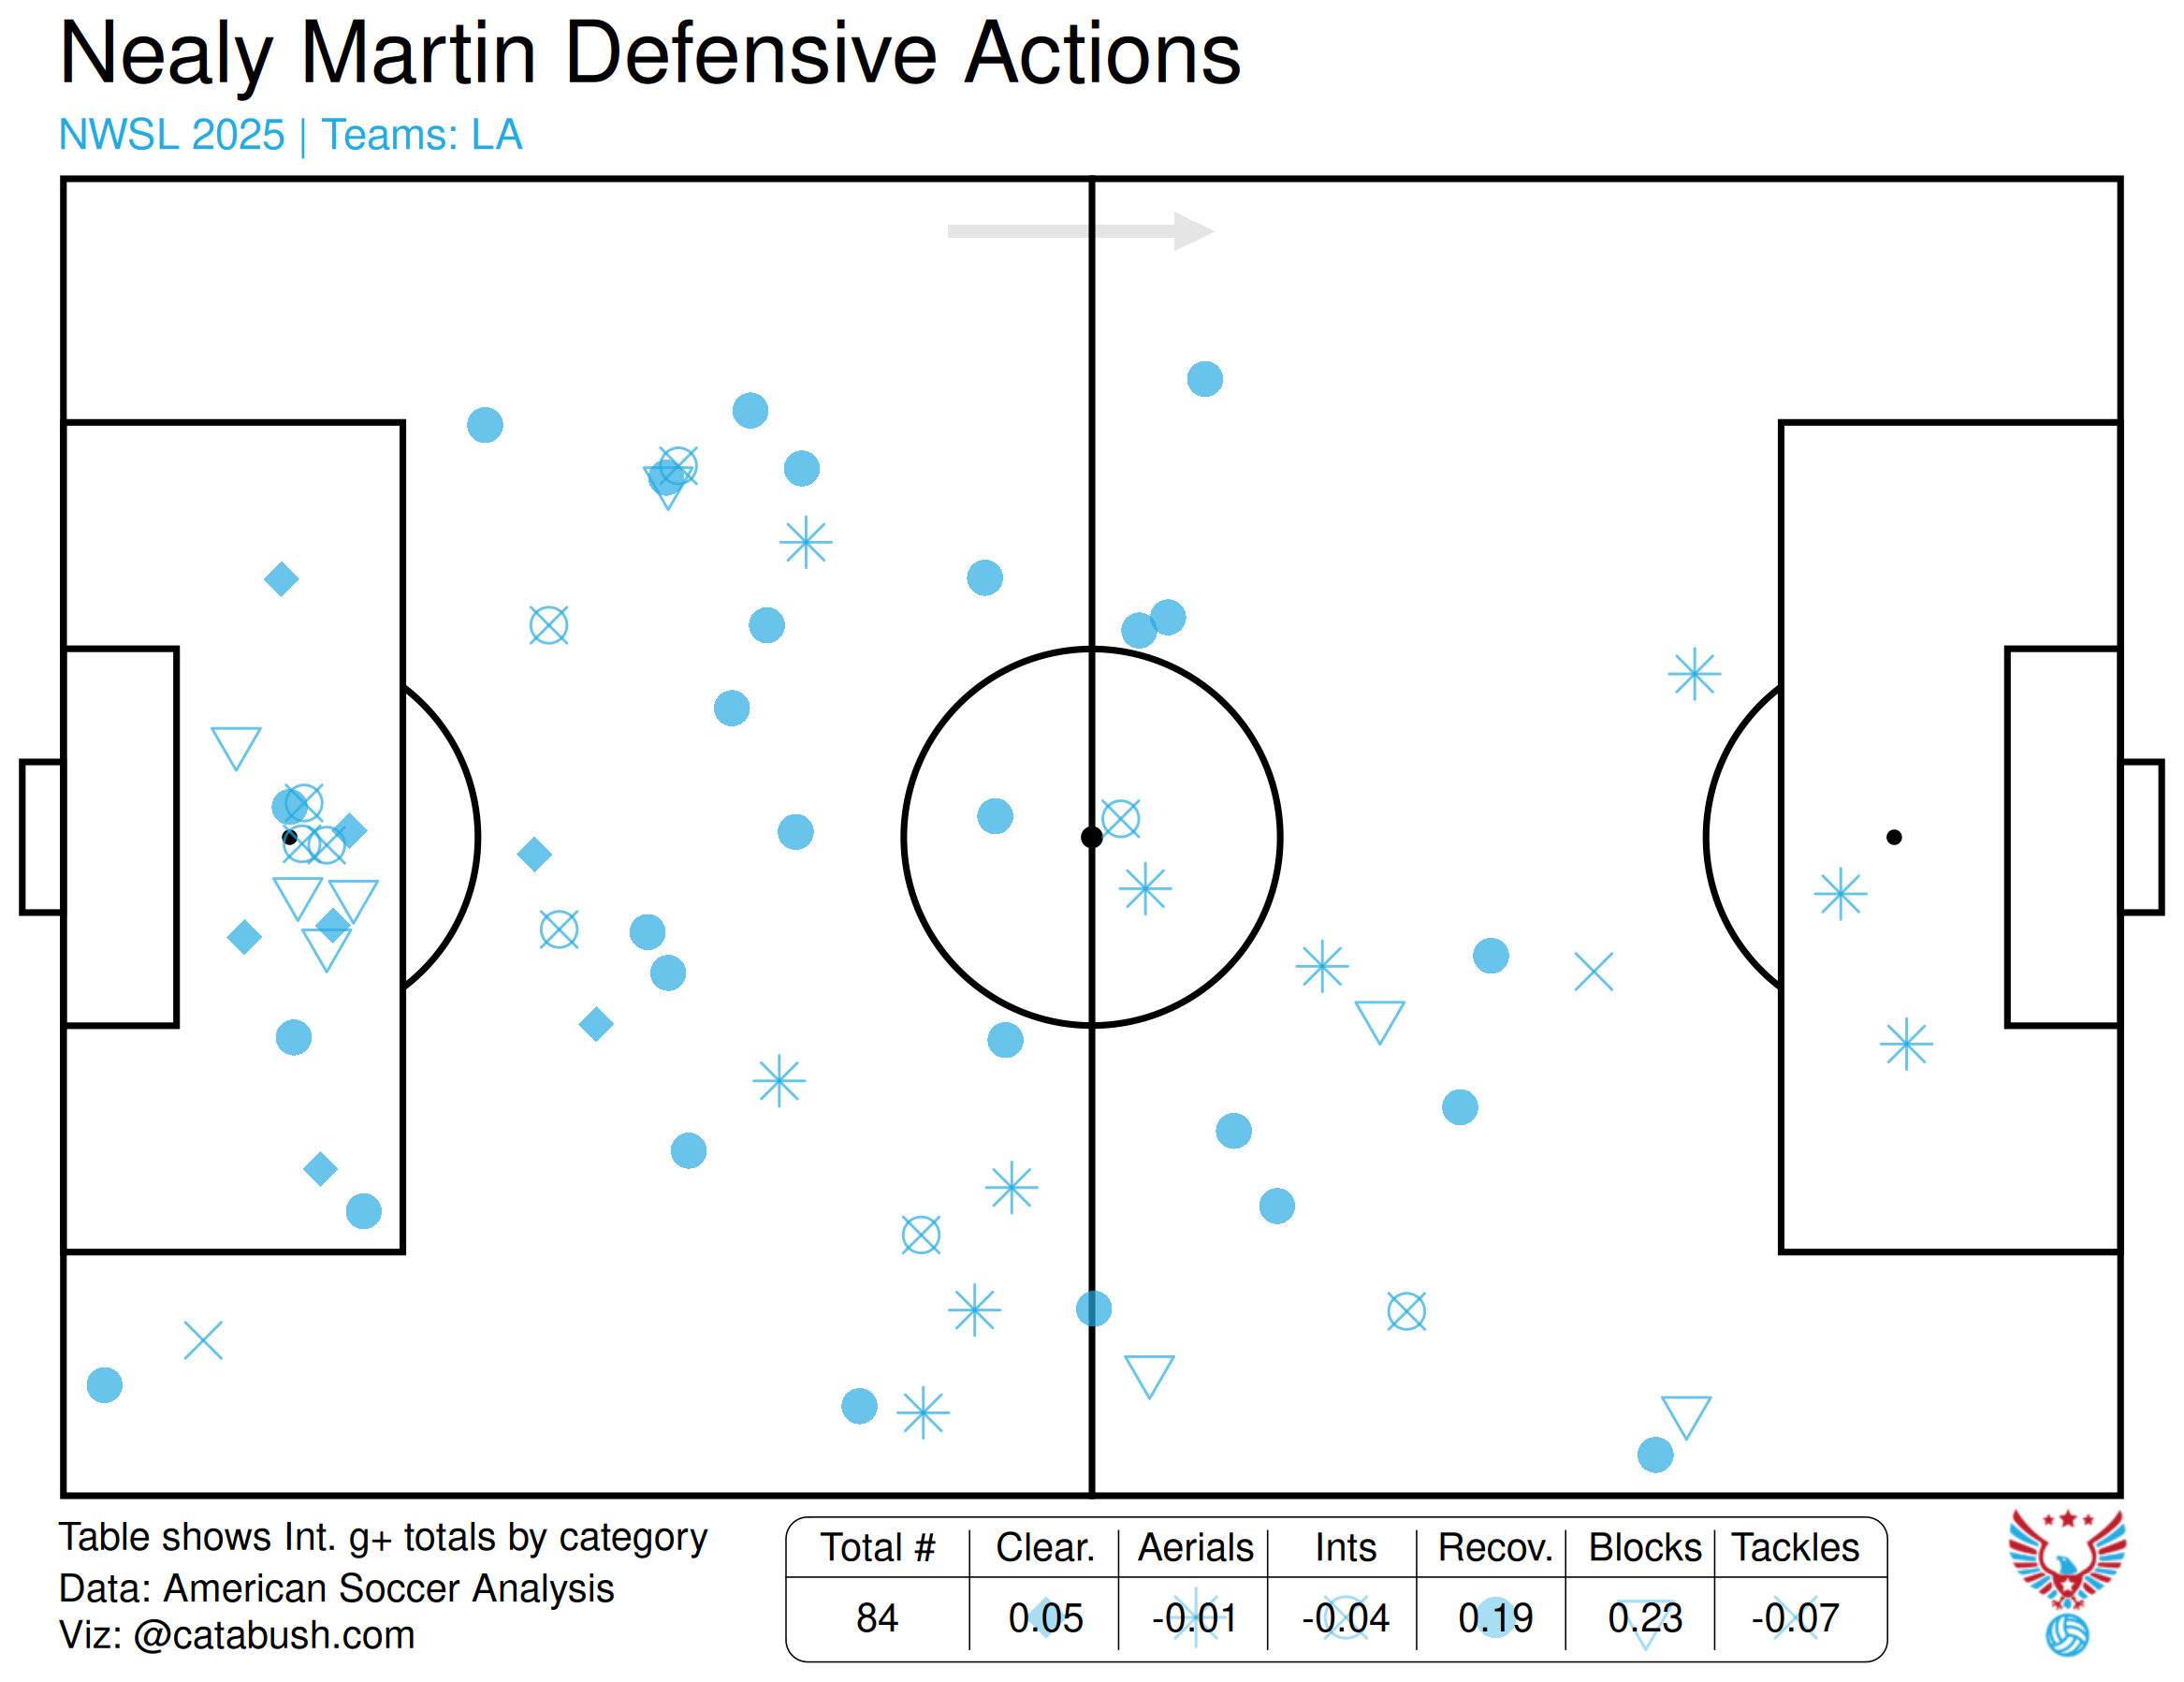
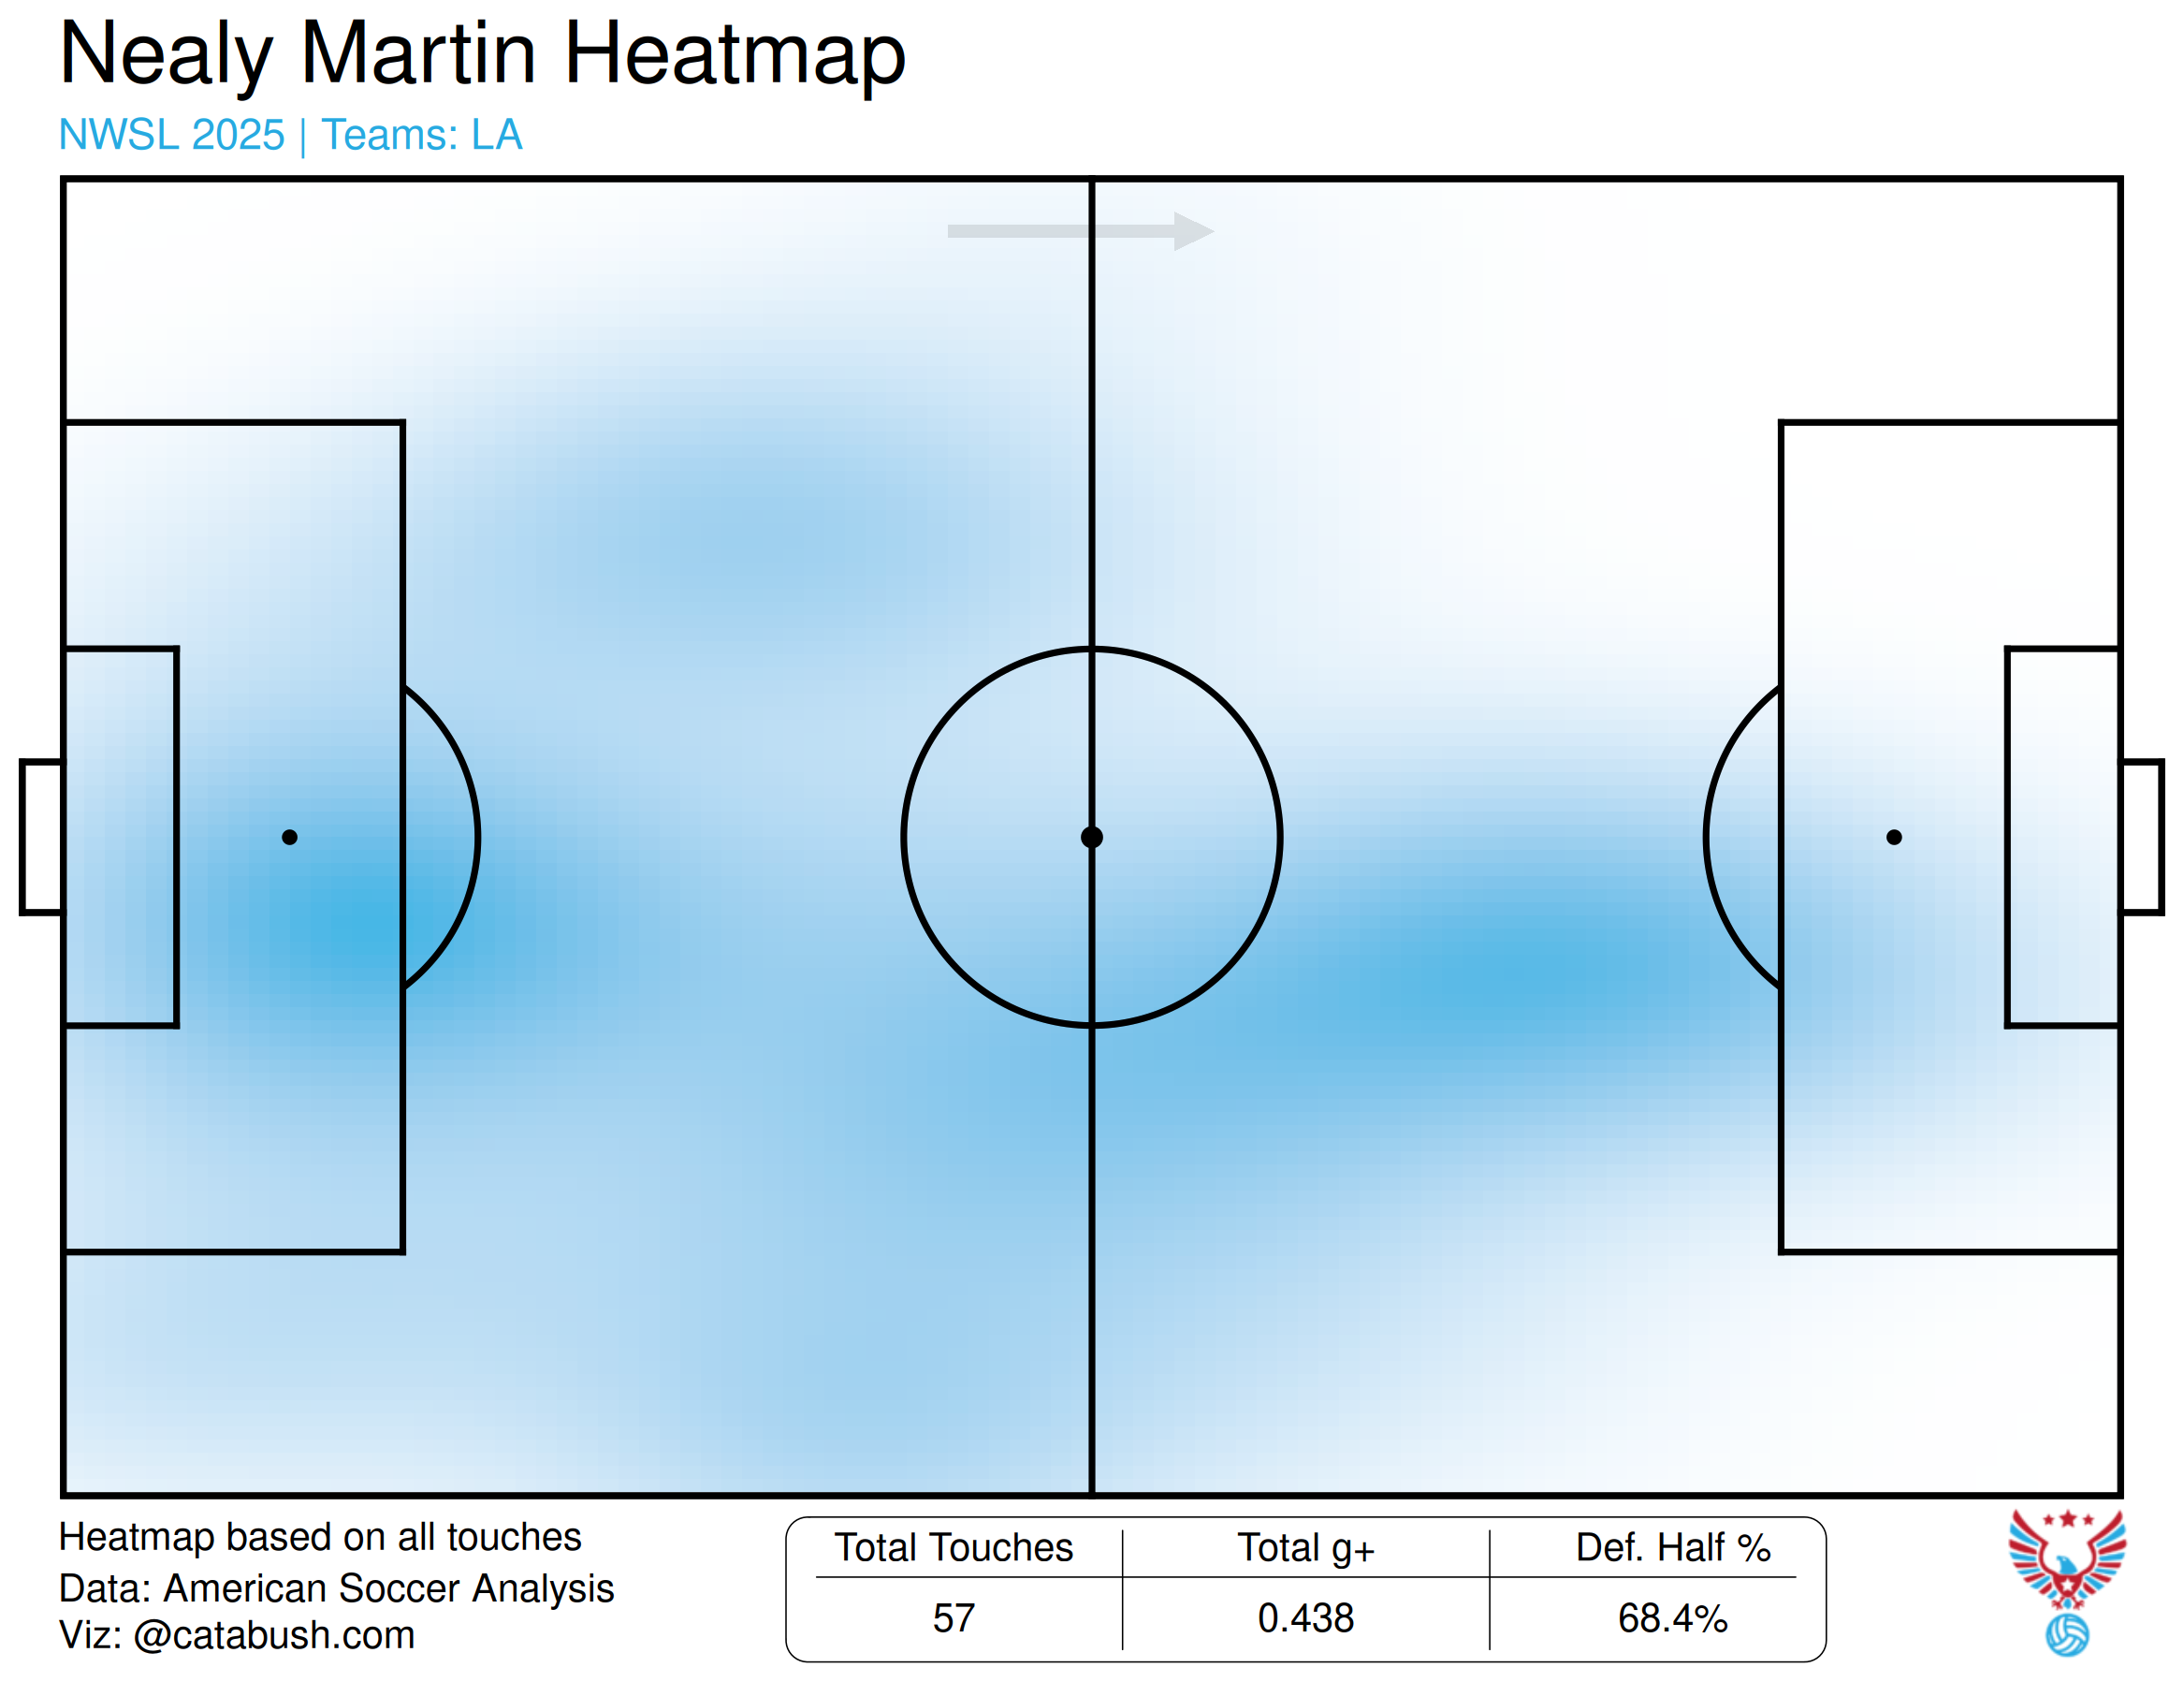
The chart above shows all of Martin’s Defensive Actions for Angel City, and the biggest contribution is from Blocks. There are 4 Blocks inside the box that really stand out here. The other thing that jumps out to me in this chart is the Recoveries, which make up the second-most amount of g+ for Martin’s defensive actions. These Recoveries are all over the field, and I think are reflective of the mobility that Martin brings. She covers a lot of ground and plays at a high tempo. She will track back when needed, all the way to the end line, and also from one side of the field to the other. In contrast to Hodge, I don’t think that Martin let’s herself get pulled out of position, and her high rate of Interceptions speak to that. The heatmap below shows how much of the pitch Martin can cover, without compromising the team’s defensive shape.
That said, I think that Martin’s Interrupting g+ scores are concerning. She is not a true defensive specialist in the mold of someone like Sam Meza. My impression is that the more possession her team has, the less of a concern Martin’s defensive contribution would be. She would be very good at chasing down loose balls and maintaining possession, but will not shine on a team that is sitting deeper, allowing the opposition to organize, and forcing her to repeatedly try and tackle dribblers.
Possession
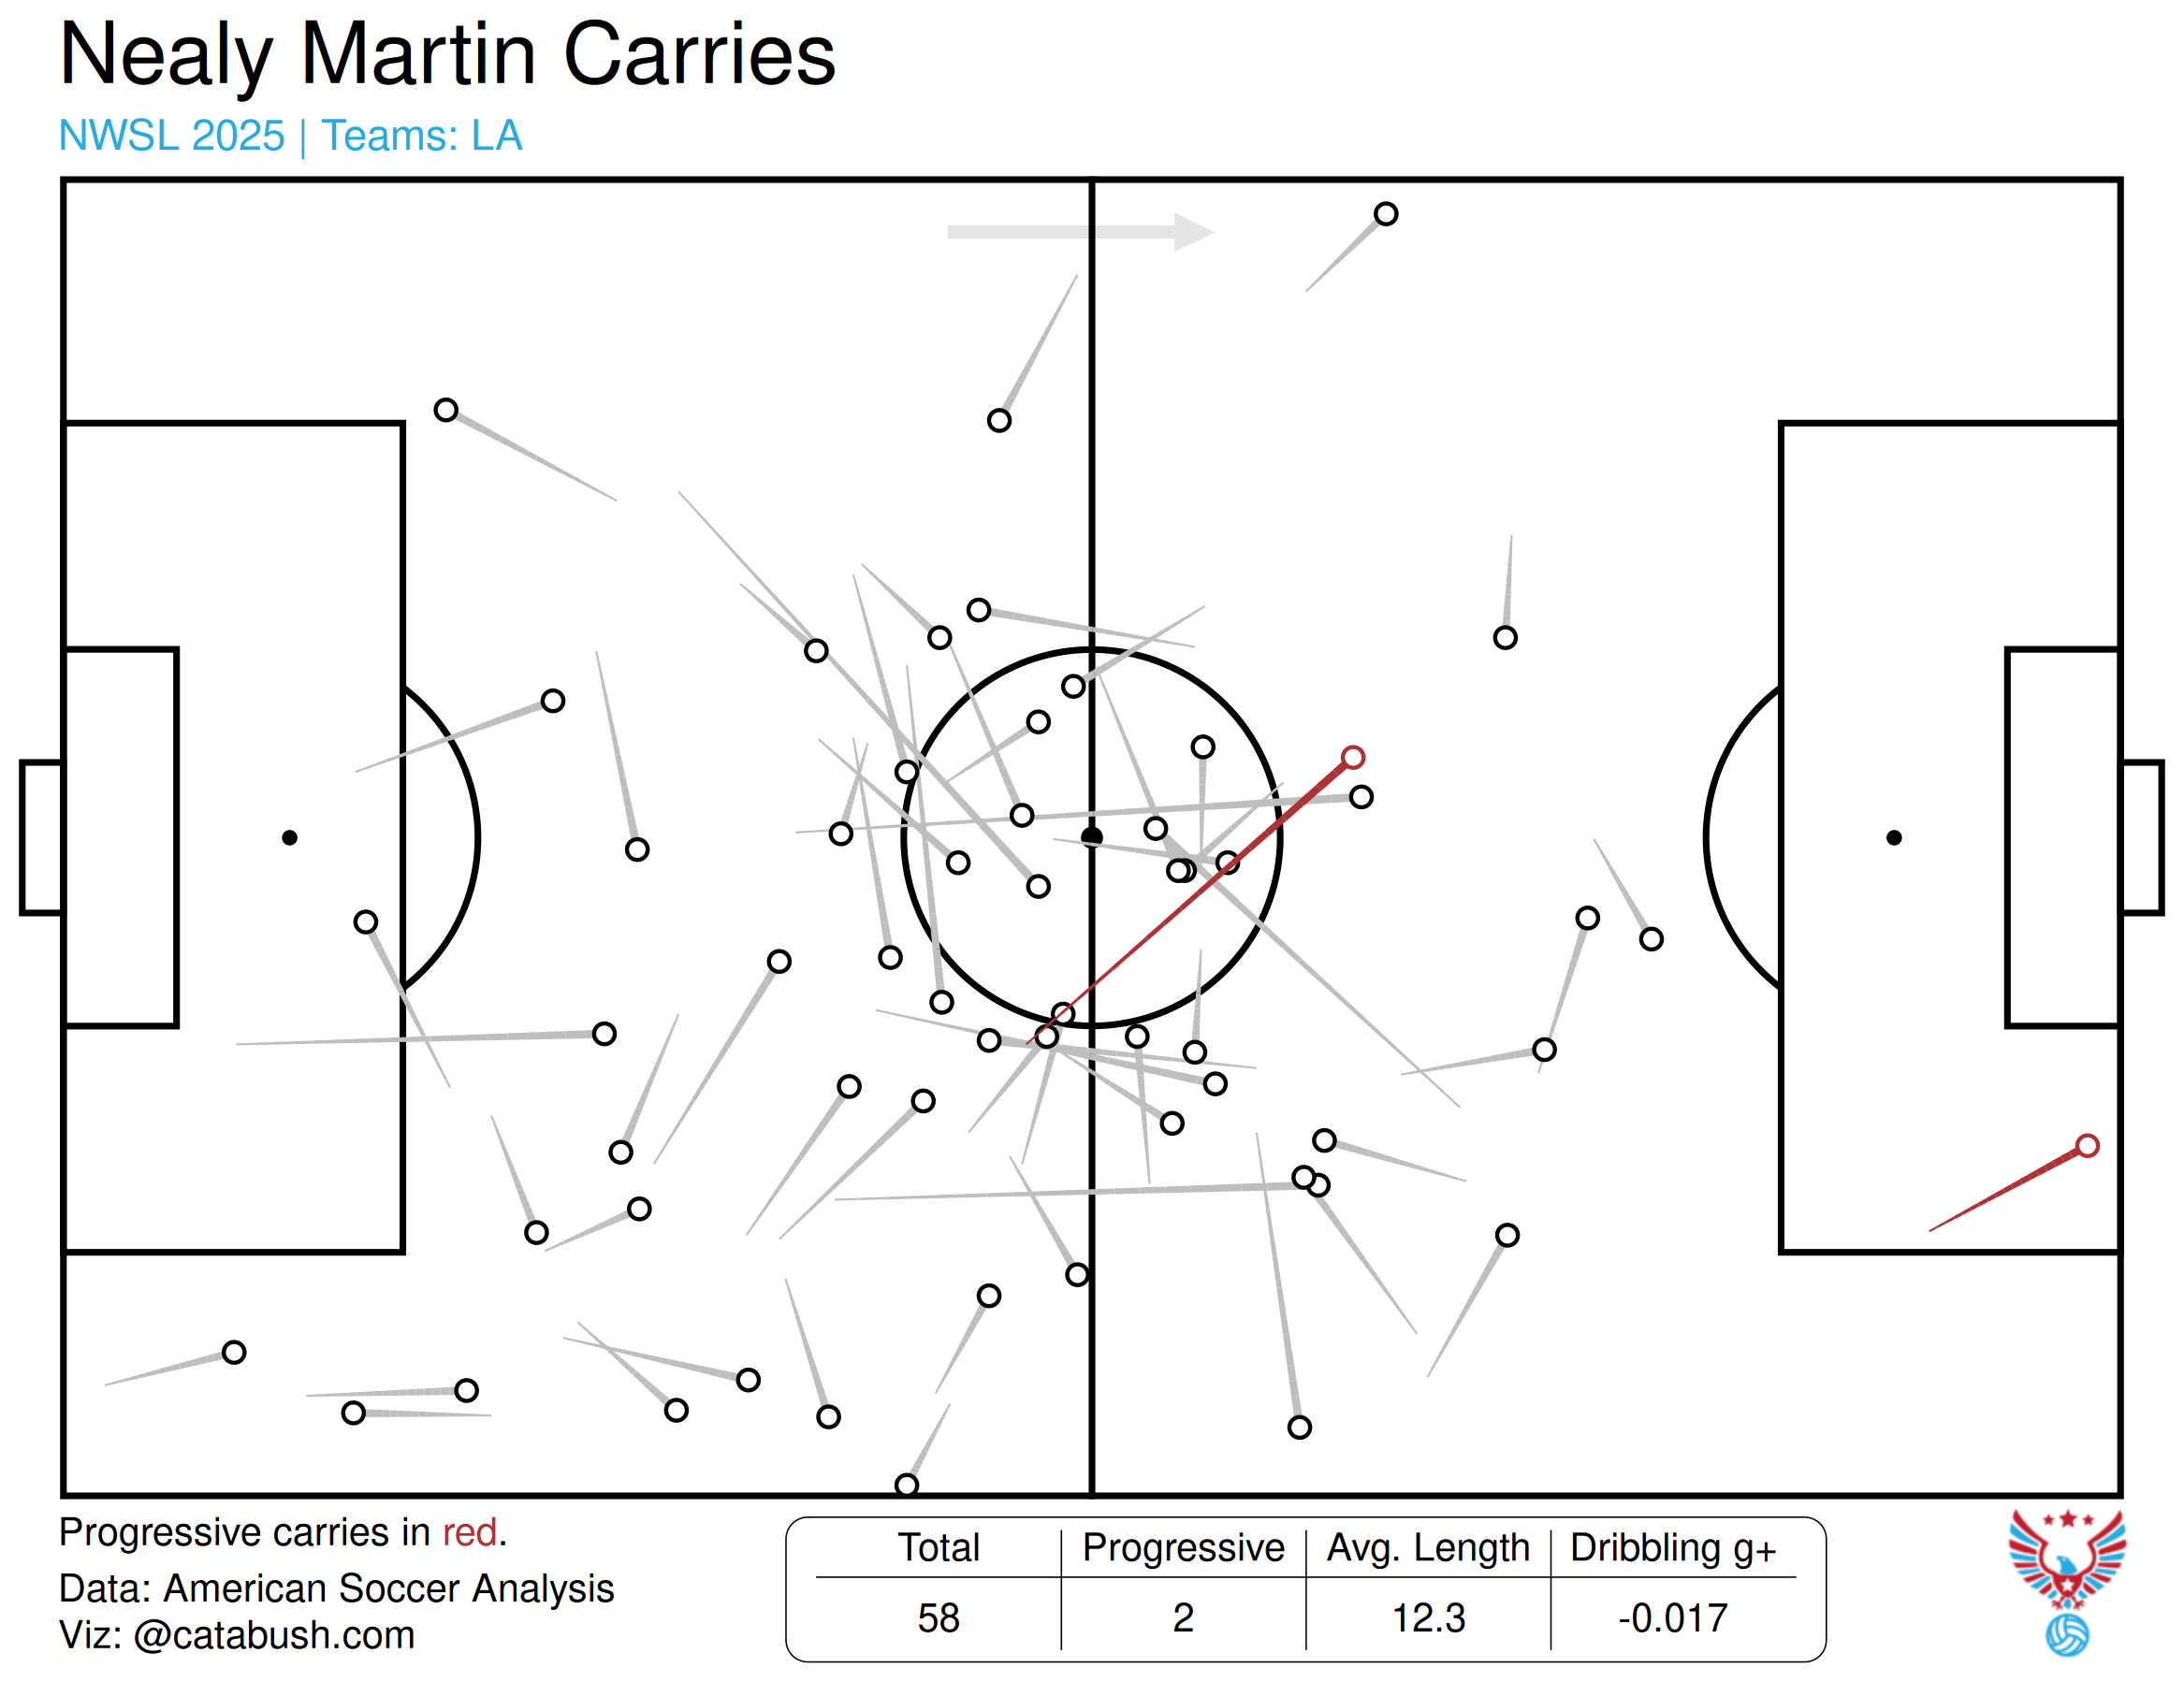
Martin had 8% of her team’s Touches (combining both Gotham and ACFC), which was in the 65th percentile, but it should be remembered that her games as a defender with Gotham will inflate that a little bit. Martin was decent on the ball, with 25 Carries per 90 for ACFC (55th percentile) and 0.62 Progressive Carries per 90 (42nd percentile). Her 10 Touches in the Attacking Third is only in the 30th percentile, but amongst ACFC players, only Zelem and Sugita had more, so Martin’s addition can be viewed as an improvement in this area. Looking at her Carry chart below, the thing that stands out to me is how many of Martin’s Carries were through the middle of the pitch. She doesn’t have the typical profile of retreating to the open space on the wings. Martin’s Dribbling g+ score was -0.09 (48th percentile) and she attempted 0.61 Take Ons per 90 (24th percentile).
The Receiving stats are interesting for Martin. This section of her g+ is -0.53 (26th percentile). However, Martin also had 2.0 Progressive Passes Received (48th percentile). The Receiving g+ was the worst among Angel City central midfielders, but the Progressive Passes Received was behind only Sugita and Zelem. I think that the g+ part is due to how much ground Martin covered; she is not waiting in the best spots to receive a pass because she does so much running over the rest of the field. However, Those Progressive Passes Received show that she does do a better job at getting herself into spots help the team move the ball upfield.
Conclusion
Martin’s Total Goals Added was -2.22 and was the worst mark among NWSL Central Midfielders, and the third worst mark overall. I don’t think this is exactly fair to her, but has to be acknowledged. After my analysis, I would reiterate my initial assessment that Martin is a utility player, and I think that the NWSL is a league that demands specialists at this point. With the addition of Borges, I will be interested to see if Martin remains a starter. My feeling is that she is most effective off the bench, but I would envision her as a player that still gets minutes every match. Her versatility means that no matter the game situation, she can be brought in some kind of supporting role, and her energy will be even more effective later in games. I think that there is a reason why Gotham was willing to part with her while they were in a championship window, though I am a little surprised given the added demands of international competition. I don’t think that Martin as a starter is going to give any team the quality to be one of the top teams in the league, but I do think that she provides very important depth.
In a rare instance, we have what I consider to be the team’s best player for the positional group with the fewest minutes, but that’s the result of a late season trade. Sugita played 4 games for Angel City that were all complete games, giving her 360 minutes. This is too small of a sample size to make any accurate deductions, so I’m only including Sugita’s Portland stats in the radar plot. At the same time, her role with Portland is different, where so much of their midfield structure was about giving Moultrie the freedom to create. Consequently, I won’t go into quite as much detail, because it’s not applicable to either evaluating her time with Angel City last year, or predicting her performance for next year. For the 2025 season, Sugita had 1,903 minutes (26 games and 22 starts).
Passing
In my unsupervised clustering, Sugita was actually identified as a Box to Box Ball Winning Midfielder. This surprises me a little bit, as Sugita isn’t in the same mold as some of the other’s in this cluster, like Taylor Flint or Sam Meza. Deep Lying Playmaker might seem more fitting, but Sugita doesn’t really have the passing volume for that. The fact is that in Portland, Sugita had to fill in the gaps, and the structure was built to maximize the skills of Coffey and Moultrie. At Angel City, I think that Sugita is the star player in the midfield, and we got glimpses of that at times, but joining a new club late in the year does make that difficult. I’m really interested to see what her role looks like this coming year, with both her and Straus getting to have a preseason.
Even so, Sugita does seem like the best passer in the ACFC midfield (Hammond might have a claim, but of course, has since departed for Utah). Sugita has the highest xPass score of Angel City midfielders (+22.80, 81st percentile), and is just behind Hammond on a per 100 minute basis (2.51 to 2.65). Interestingly, Sugita’s xPass didn’t change too much between teams. She had +2.51 per 100 with Portland and +2.49 per 100 with Angel City. The Pass Attempts didn’t change a lot, either, with 42.05 per 100 with Portland and 39.62 per 100 with ACFC. However, the Completion Percentage did change a lot. Sugita had 78.3% (75.8% expected) with Portland, but that dropped to 72.9% (70.4% expected) with Angel City. She was still exceeding her expectations, but simply was playing more passes that the model wasn’t expecting to be completed. Sugita actually has the second lowest expected percentage, only ahead of Macey Hodge.
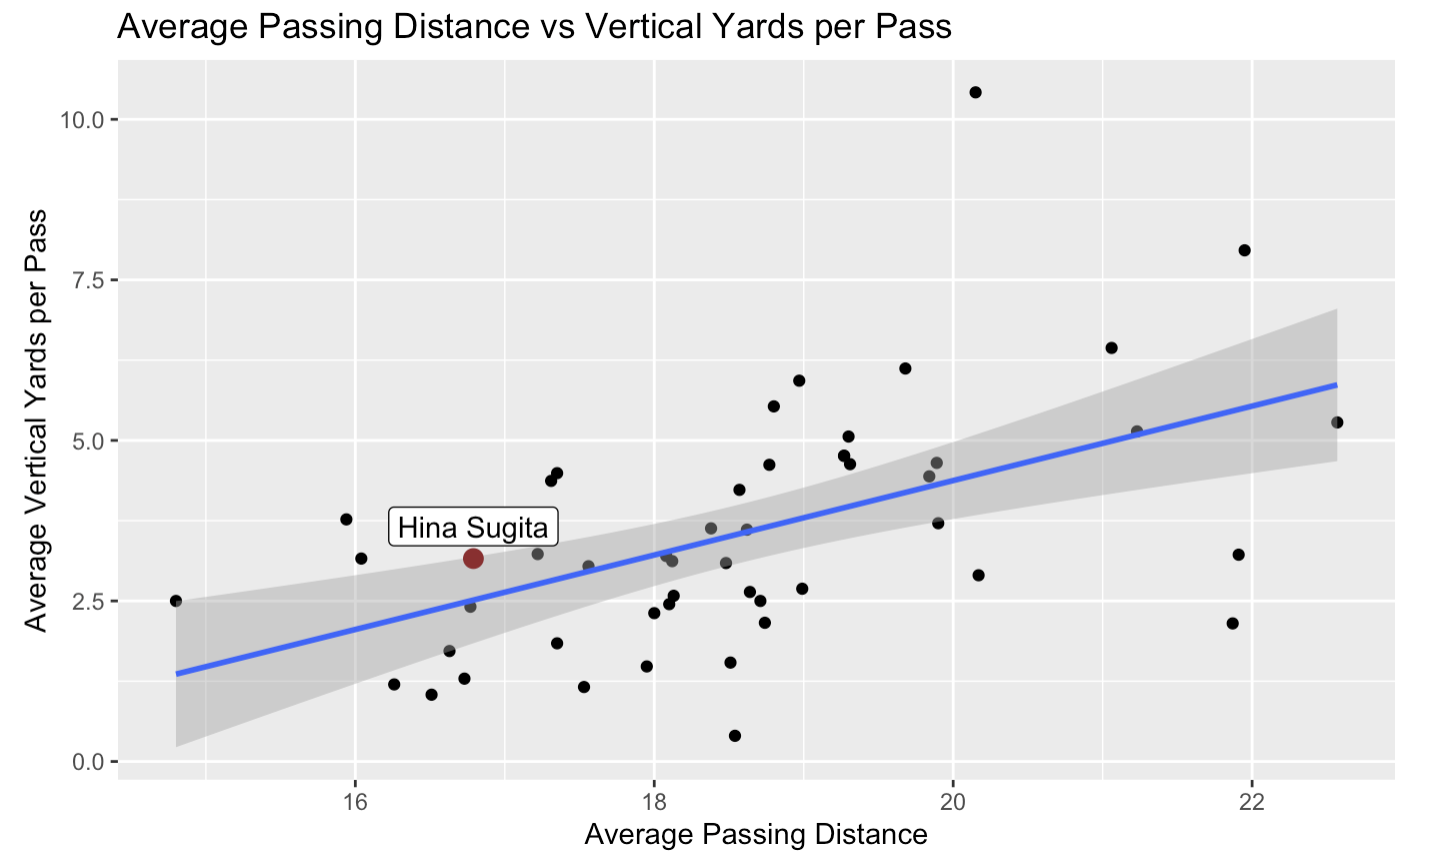
Passing Completion Percentage has always been a stat that doesn’t mean a lot to me on its own, because it can so easily be inflated by making safe passes. And while maintaining possession is one important role of passing, so is progressing the ball and destabilizing the opponents defensive structure. So keeping that in mind, we look at Sugita’s other stats. She averaged 3.16 Vertical Yards per Completed Pass (46th percentile). This is obviously not a lot, but at the same time, Sugita doesn’t attempt many long passes either. She only Attempts 2.10 Long Pass Attempts per 90 (6th percentile) and has a 47.2 Completion Percentage on those passes (30th percentile). There is a statistically significant correlation between Distance and Vertical yards (p value = 0.0001), but the R squared is only 0.272. We can see in the plot below that Sugita does get more vertical yards out of her passes than average.
She is also averaging 4.80 Progressive Passes per 90 (67th percentile), and 1.23 Passes into the Penalty Area (87th percentile). The latter is the most among Box to Box Midfielders.
Most importantly is the Passing section of her g+ score. For the entire season, Sugita had a +0.28 (87th percentile). That was +0.23 with Portland and +0.05 with Angel City. Even that +0.05 alone would put her in the top quartile. So while Sugita doesn’t look like the player to dictate a game, like a Kenza Dali, she does provide a lot of value with her passing. Ideally, she will be able to maintain that value per pass, while increasing her completion percentage as she gets to know her teammates better, and they get to know her. It was indicative, I thought, that in her first few games, she had the strongest connections with Endo and Moriya, both of whom she played with on the Japanese National Team.
Offensive Contribution
On both the Thorns and ACFC, Sugita played behind a more clearly attacking midfielder, but she actually has very good offensive numbers, despite her deeper role and having a down year in 2025. Sugita had 0 Goals + 3 Assists, but this was from a 3.4 npxG, 3.5 xAG, and 2.5 xA. Historically, Sugita has also put up good numbers, with 6 Goal Contributions in 2024, and 9 in both 2023 and 2022. There is every reason to believe that these number will bounce back.
The underlying statistics all also look strong. Her xAG was 93rd percentile, while her xA was 83rd percentile. This corresponds with Key Passes (1.46 per 90, 83rd percentile) and Shot Creating Actions (2.97 per 90, 81st percentile), as well as Passes into the Penalty Area (1.23 per 90, 87th percentile). At every level, Sugita’s playmaking looks strong. Part of the underperformance of her xAG may be that Portland was without Wilson and Weaver last year, and the finishing of their front three was lacking. It shouldn’t be a surprise Wilson and Weaver can improve anyone’s assist total. Sugita had almost double the xAG per 90 of any other ACFC midfielder, and the most Assists and xAG of any of the Box to Box Midfielders.
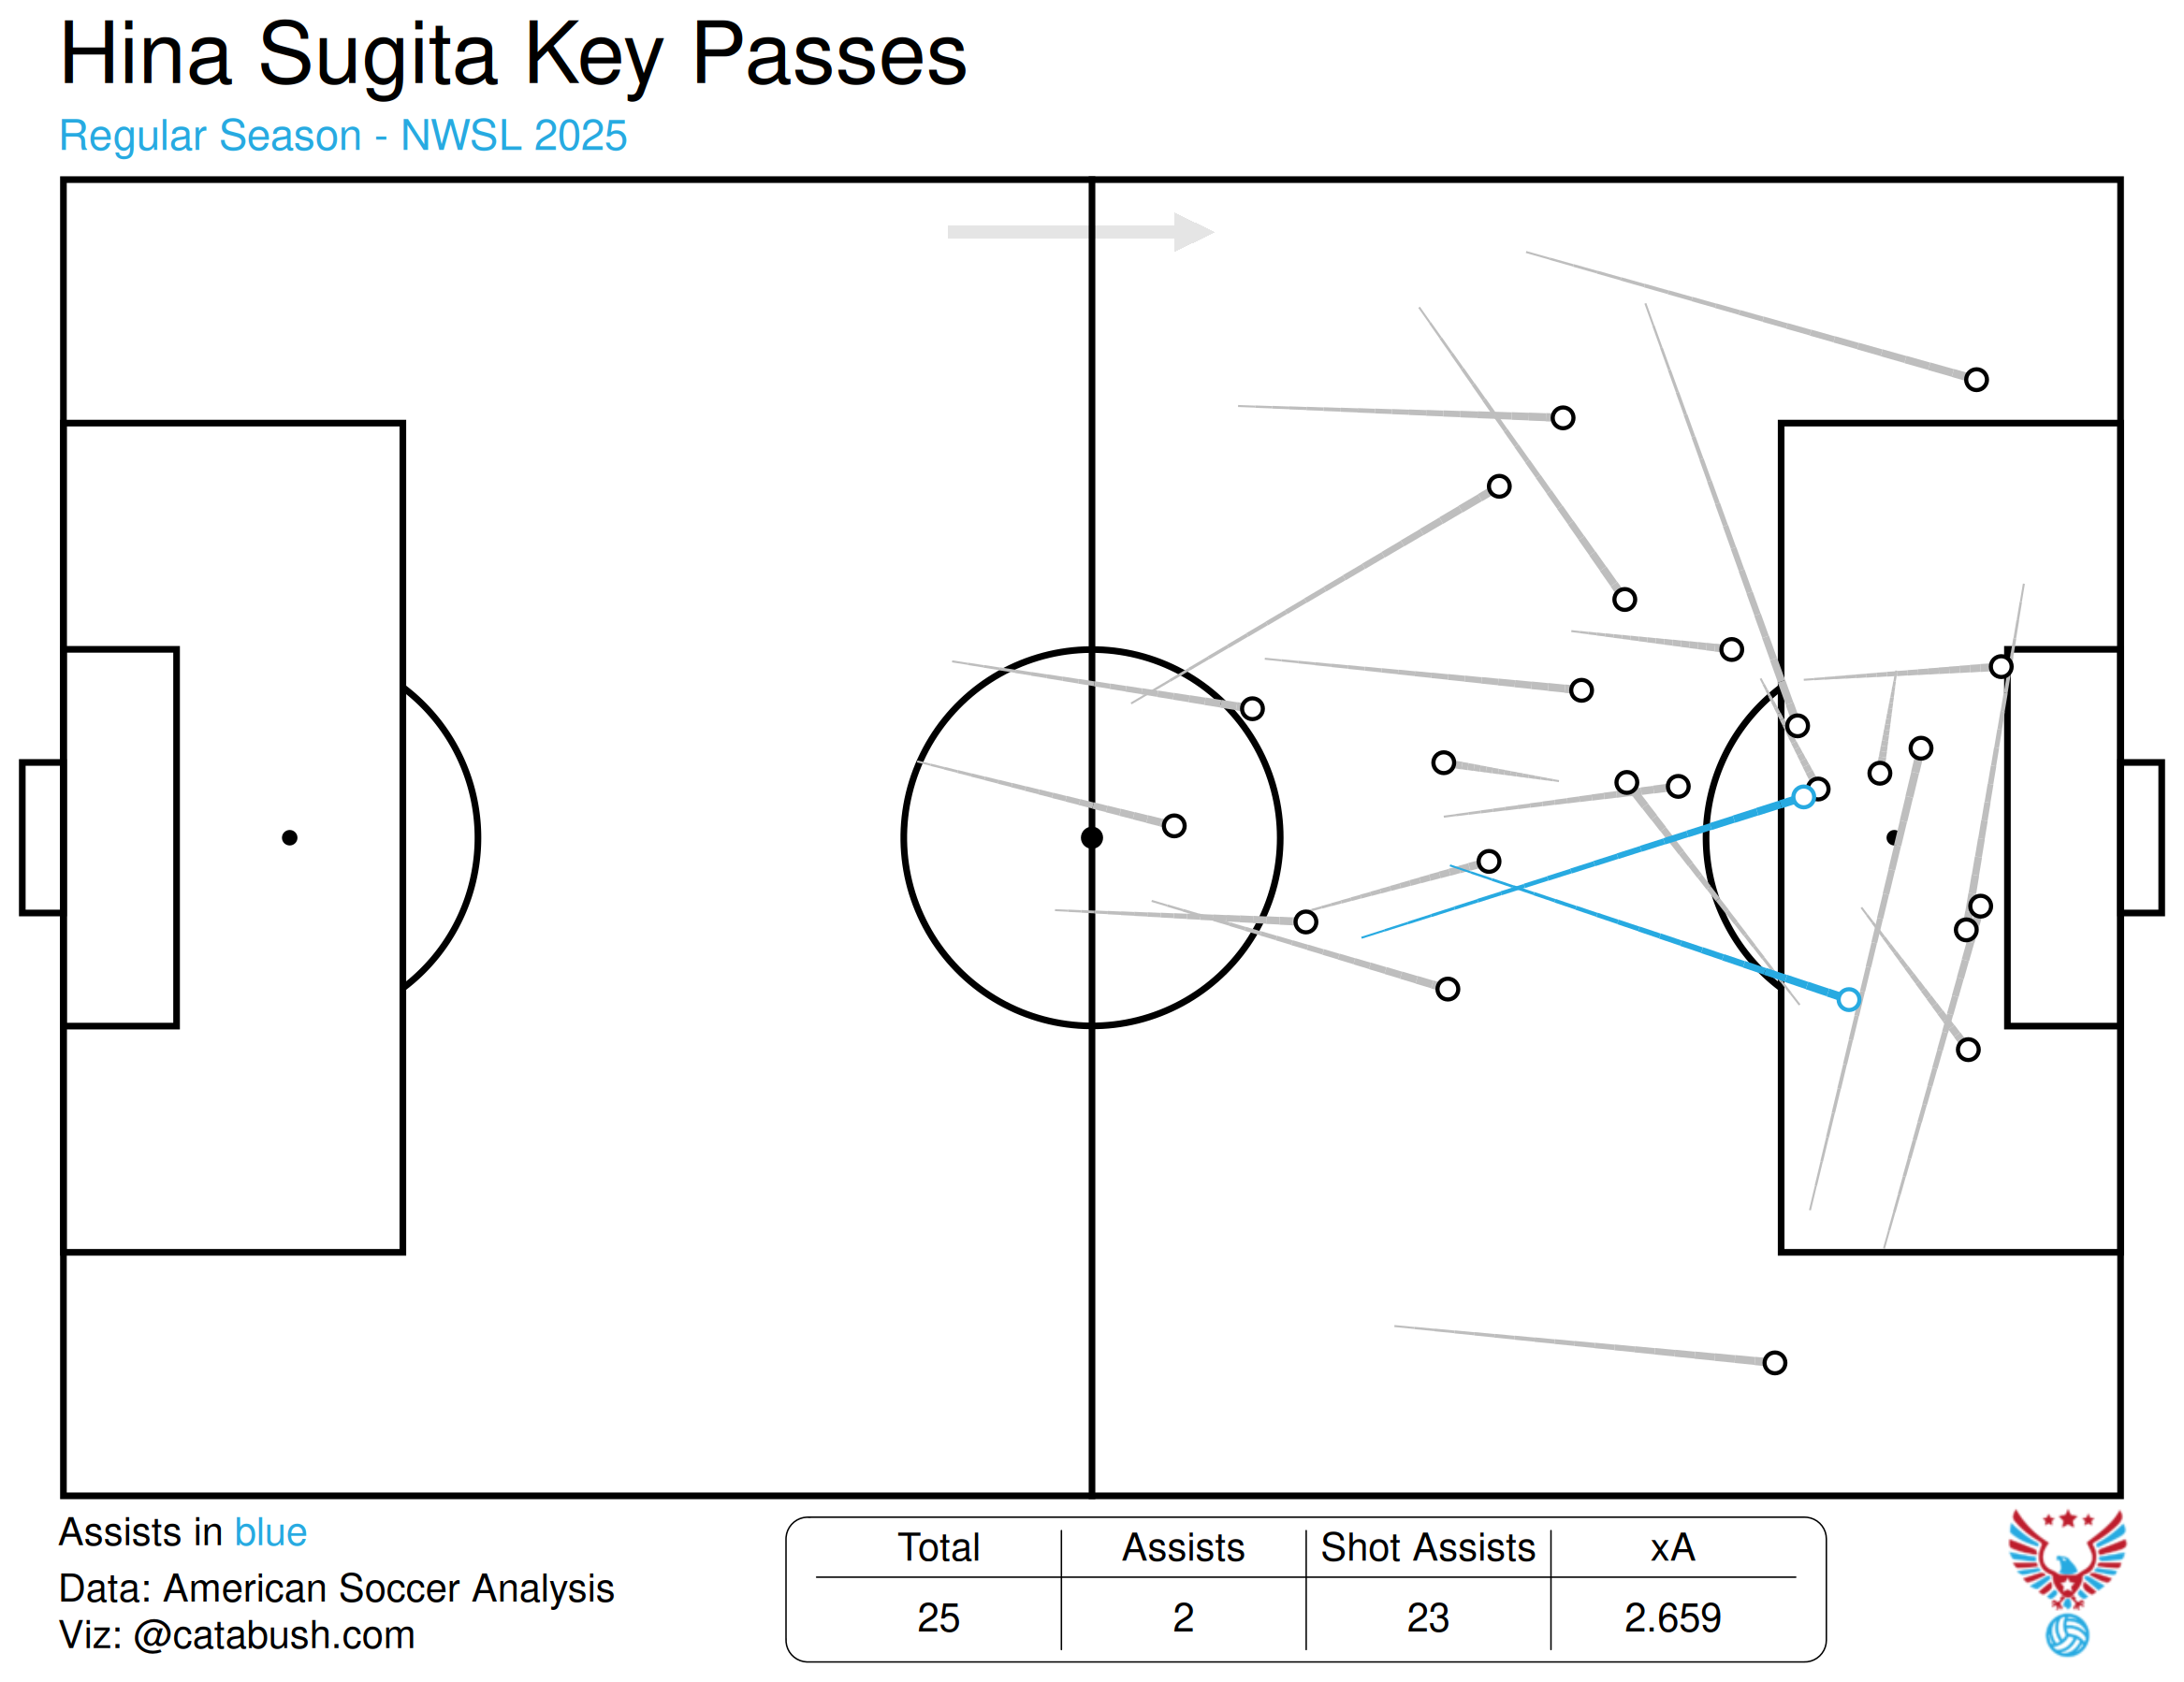
Of the Key Passes above, almost all of them are getting the ball into a dangerous position on the field. None of this seems like a fluke; making these passes should lead to goals.
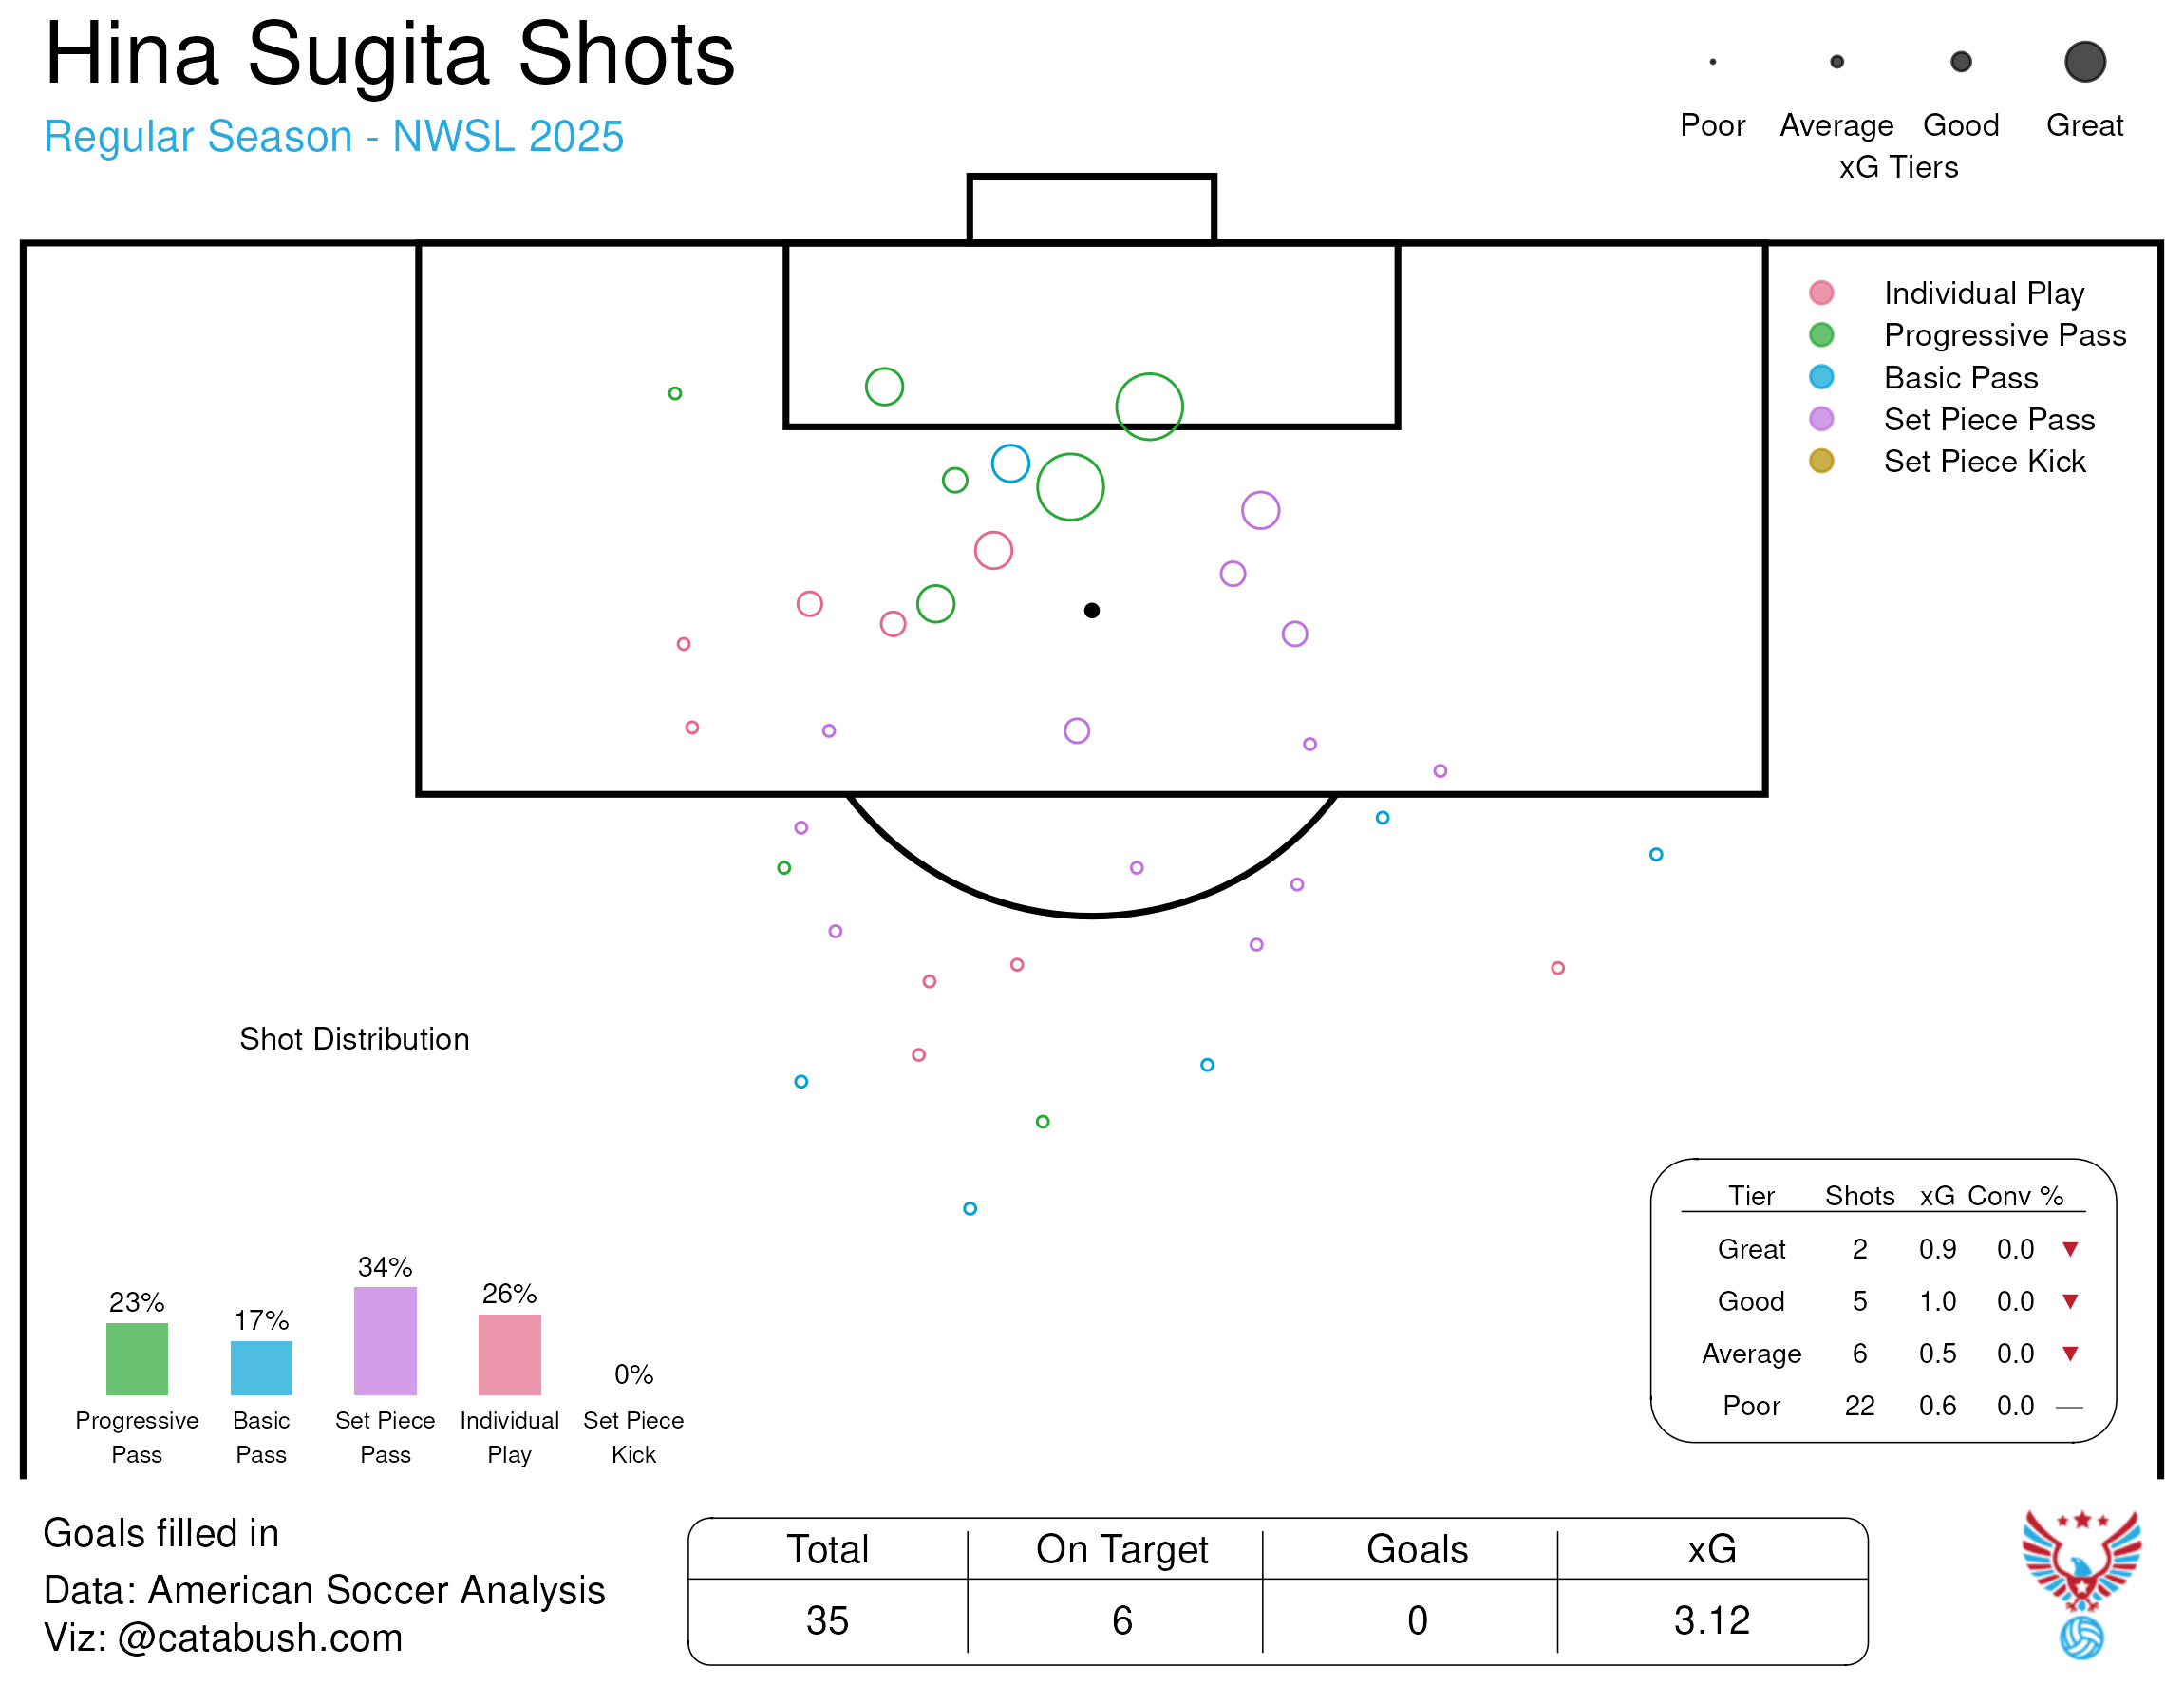
Sugita’s shooting is maybe a little more surprising. She has a career high of 6 Goals in a season, but 2025 saw her get 0 from 35 Shots (6 On Target). As can be seen in the chart below, Sugita did still get a number of good chances, with 2 Great and 5 Good Shots. She has scored these before, and she was getting the chances. It’s reasonable to expect her to start scoring again. The one caveat to this is the trade. None of those Good or Great chances came with Angel City. I also like that Sugita has 5 Shots from right in front of goal from Progressive Passes, and while I expect her to make the same kind of runs into the box, who is going to make a similar pass to her? Still, even without scoring, her Shooting g+ score was +0.24
Defensive Contributions
Defense is probably what puts Sugita in the Box to Box category. There were only 7 Central Midfielders that averaged at least 4 Tackles + Interceptions, 2 Shot Creating Actions, and 40 Pass Attempts per 90 minutes, and 6 of the them are in the Box to Box Cluster. And of these 7 Sugita had the most Shots and the highest xG.
Sugita had 2.75 Tackles (75th percentile), 1.8 Blocks (83rd percentile), and 2.1 Interceptions (93rd percentile). Her 4.85 T + I is in the 89th percentile. Sugita’s aerial presence is the one drawback, defensively. She had 33.3% Win Rate and only averaged 0.12 Aerial Duels Won (2nd percentile).
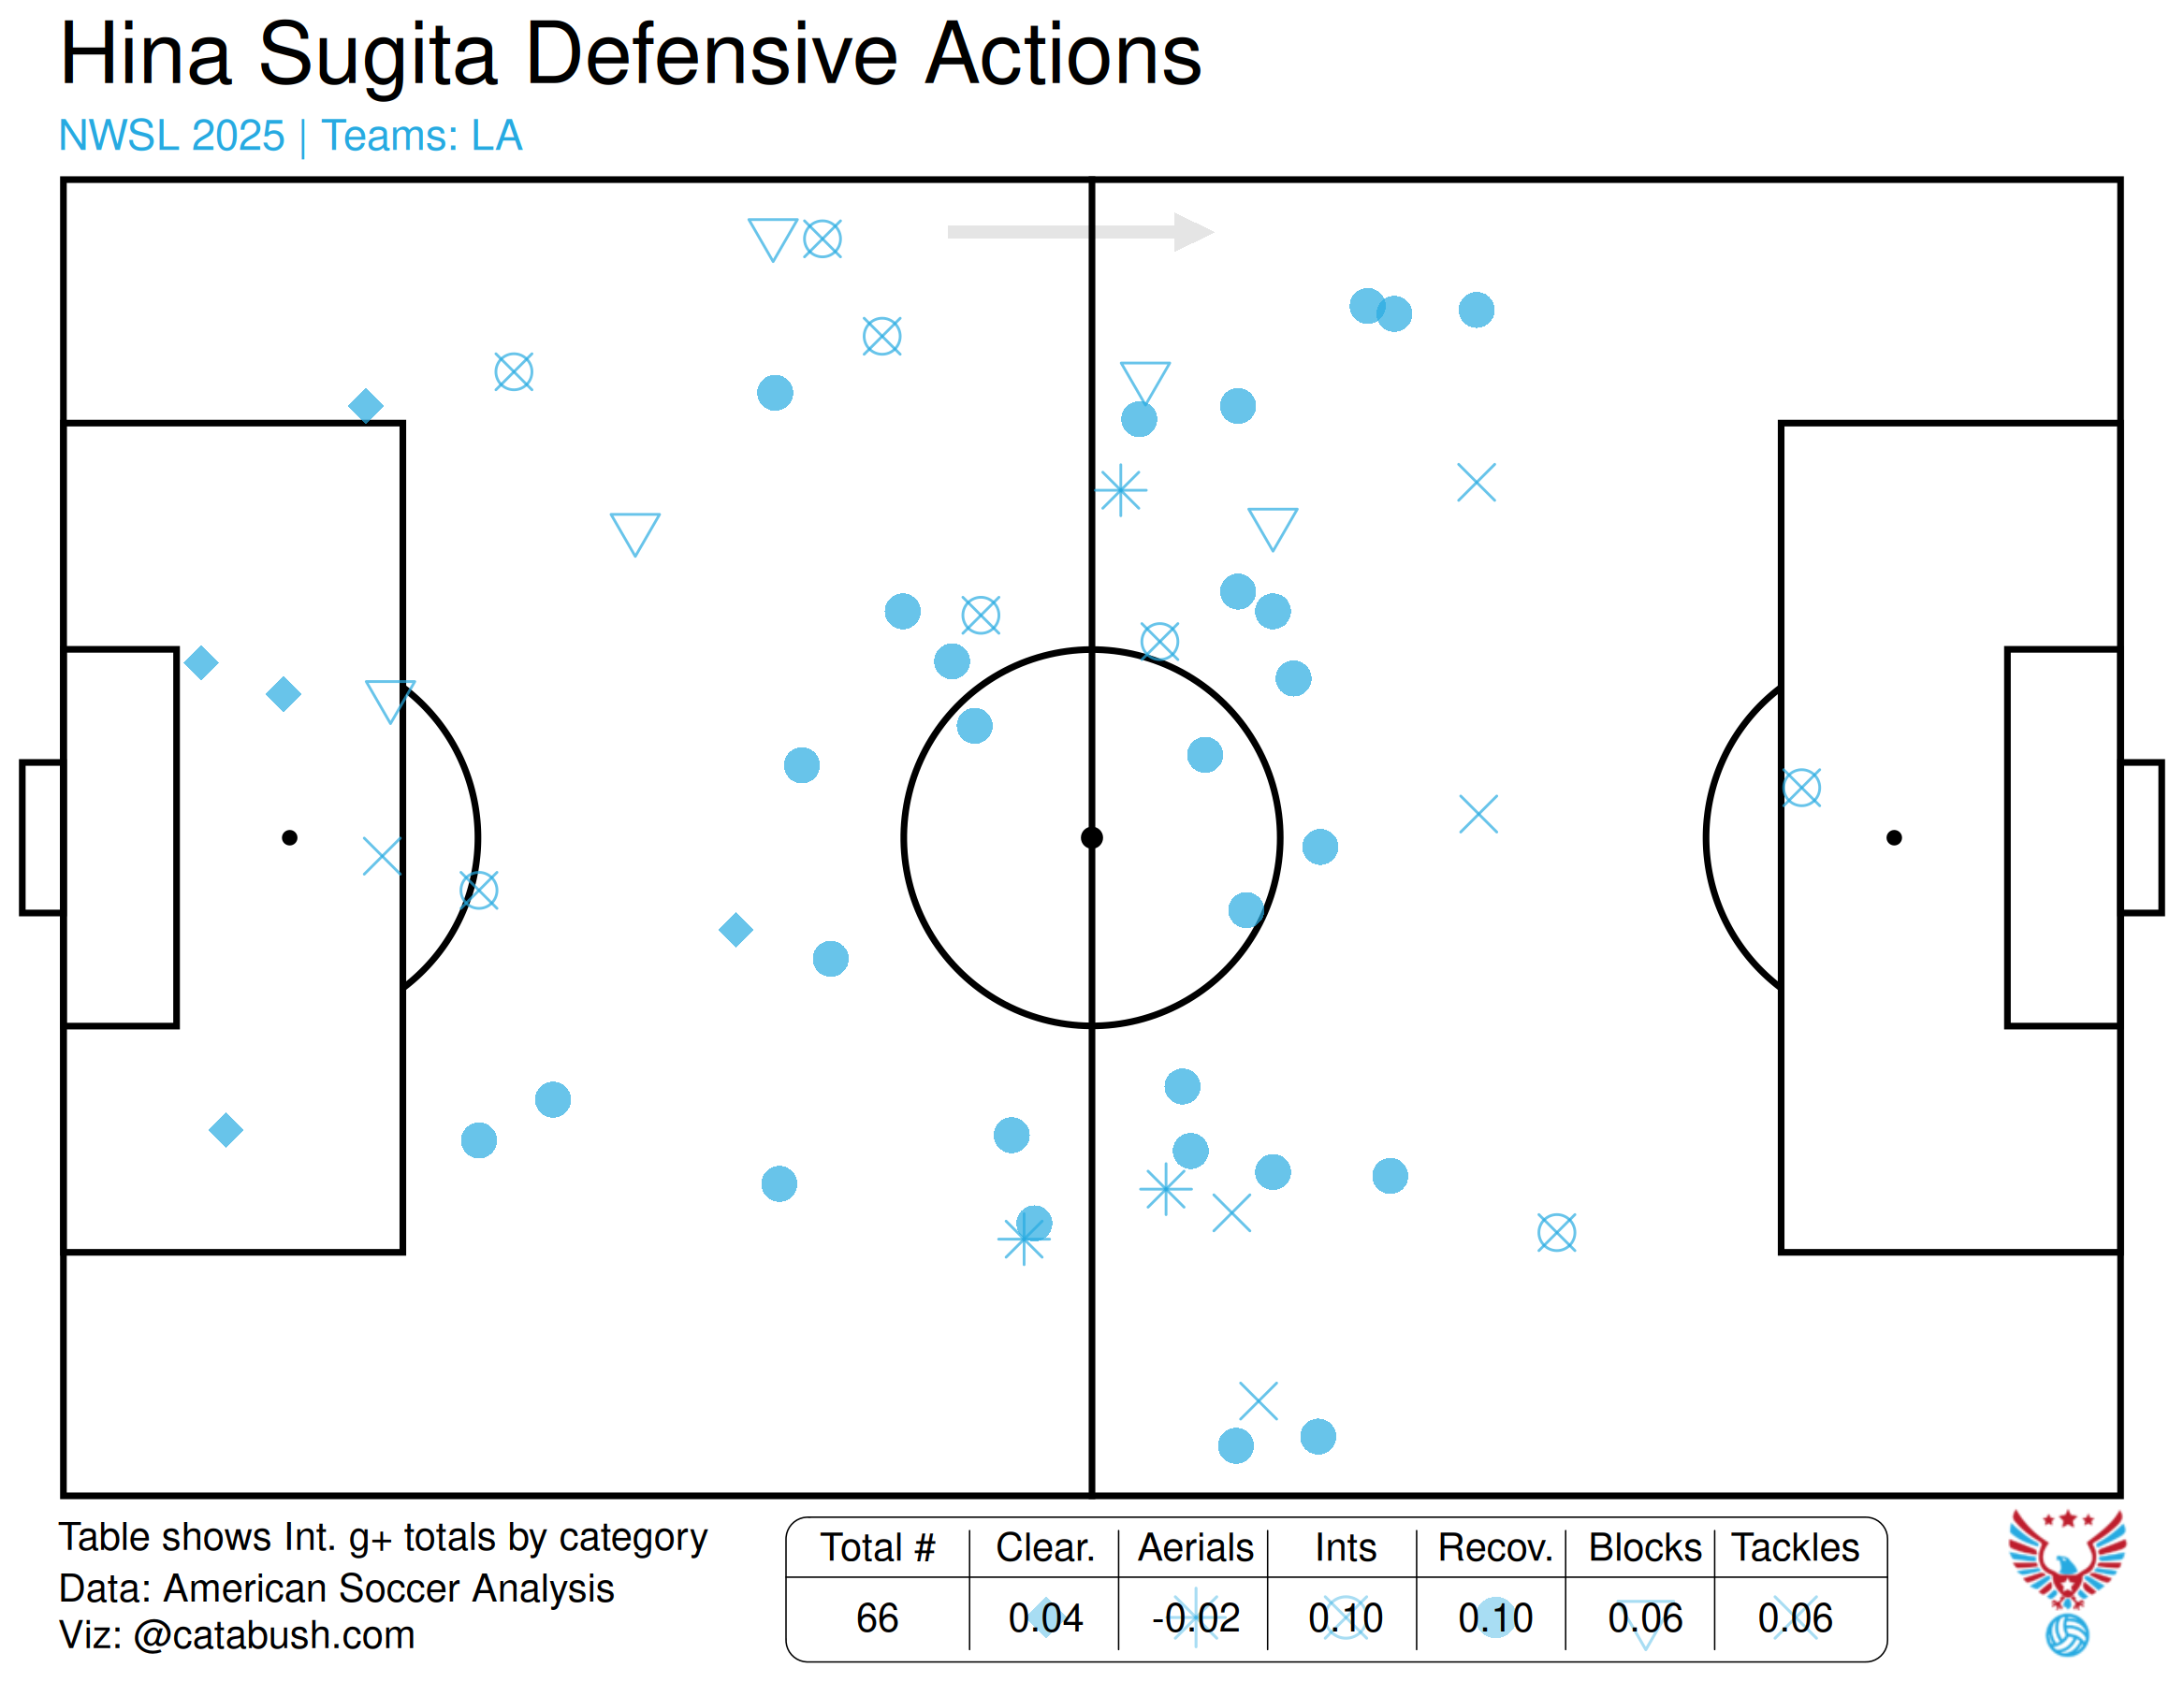
You can see in the chart above that Sugita does most of her defensive work in the middle of the pitch. Maybe the best part of that graph is the g+ totals for each category. There is no single category that Sugita relies on; she gets positive value from Clearances, Interceptions, Recoveries, Blocks, and Tackles. Despite this, Sugita’s Interrupting g+ score for the season is a -0.07 (42nd percentile). This is broken down as a +0.09 with ACFC and -0.16 with Portland. That doesn’t quite add up to me, as she has positive values in 4 of 6 categories, but due to the black box nature of the model, I can’t add more detail.
In terms of Fouls, Sugita was dead even with 29 Fouls Committed and 29 Fouls Drawn. She also got 3 Yellow Cards. Of note, though, Sugita drew 5 more fouls with Portland, but committed five more fouls with Angel City. 8 of her 10 Fouls Committed came in the final two games, so that may just be an aberration. Her Fouling g+ score is +0.02 (71st percentile, +0.07 ACFC and -0.04 with POR).
I am genuinely confused by ASA’s Interrupting g+ score, because I think that overall, Sugita is a really good defender. She tackles well, she reads the play, she positions herself well. I think that her primary job with Angel City is going to be in possession, however. Defensively, Sugita should be viewed more in terms of if she’s a liability, and if she needs a teammate to support her. My answer for both those questions is no. I think that she can handle what is necessary, but especially if she’s partnered with Borges, I’m not going to worry too much about Sugita’s defense. Angel City should not want her to have to be too focused on defense, because I think that she will often be the primary first target for a pass after Angel City regains possession.
Possession
As expected, Sugita took on a more prominent role with Angel City, getting 8.5% of her team’s Touches with Portland and 9.6% with Angel City. Her receiving g+ score was -0.15 with Angel City, but +0.19 with Portland. For historical context, she was a -0.37 in 2024 with Portland. Her cumulative 2025 score of +0.05 does put her in the 83rd percentile. Her 3.74 Progressive Pass Received (89th percentile), show that Sugita does move ahead of the ball to help the team advance. She’s not just always falling back to as the safe pass outlet.
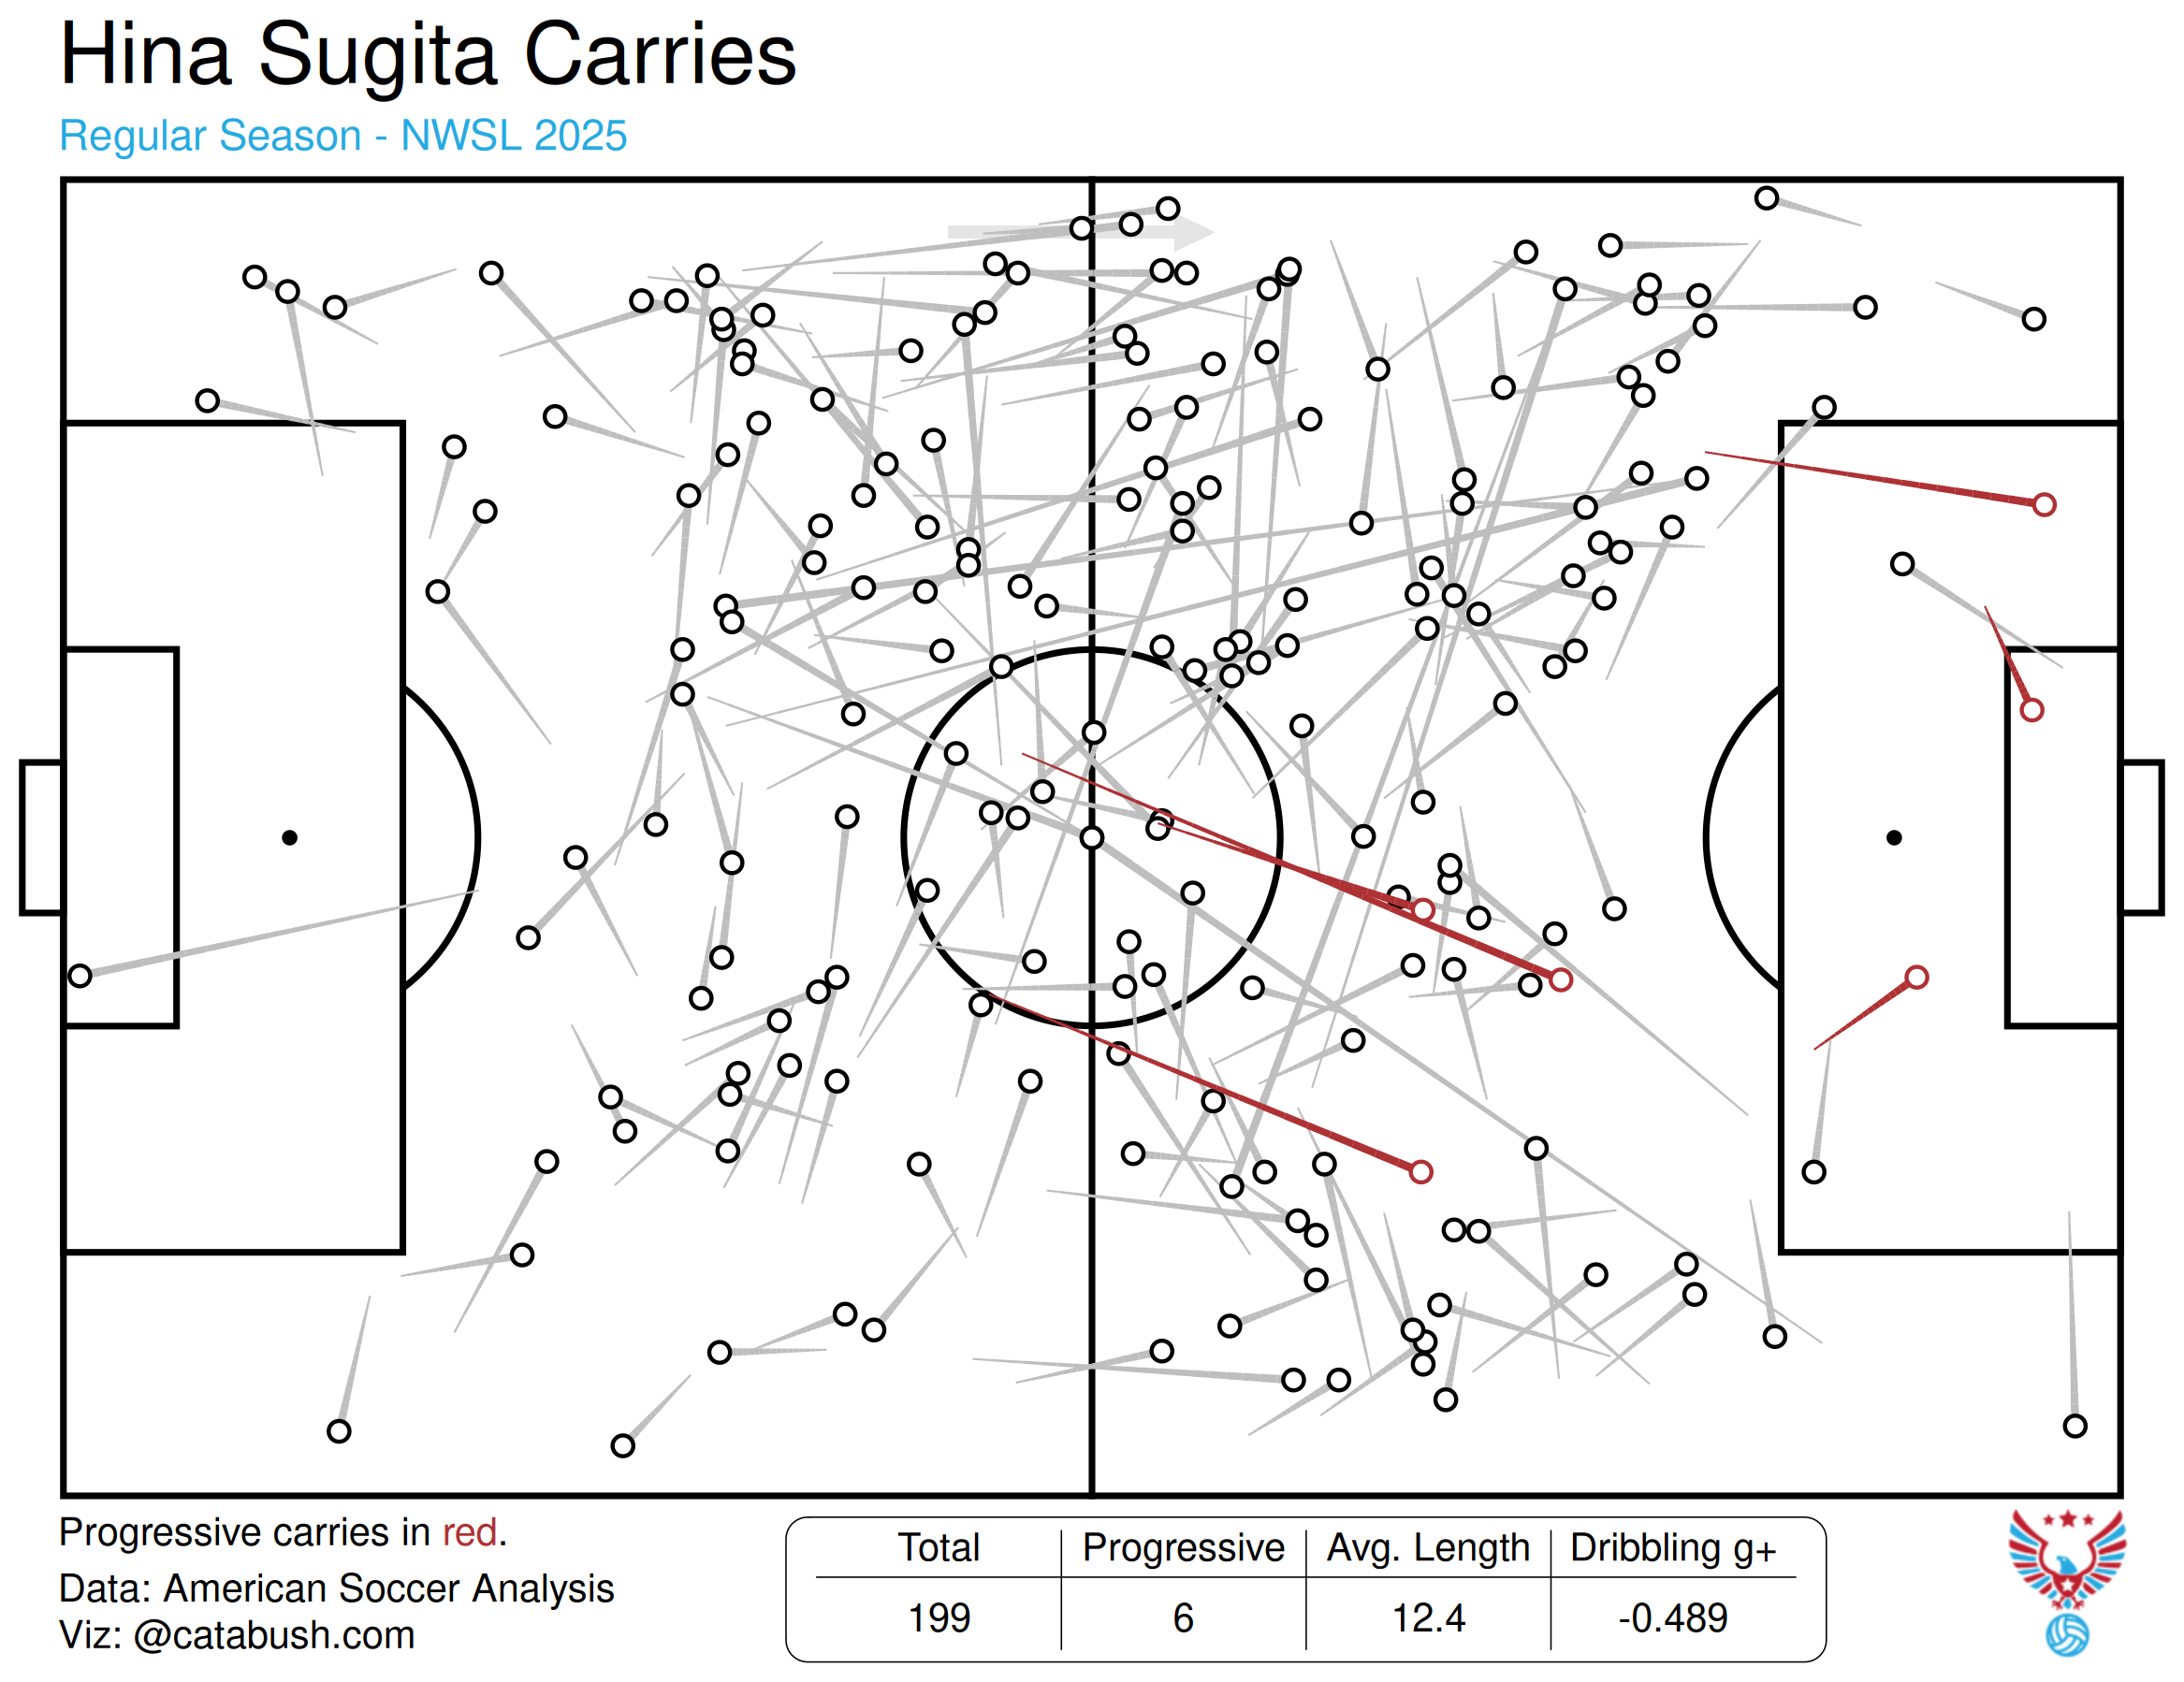
Her dribbling stats are her lowest category, however. Sugita had 27.84 Carries per 90 (71st percentile), Of that, 0.87 of them are Progressive Carries, which is still 73rd percentile. Those are both decent, but her Dribbling g+ score was a -0.54 (4th percentile). She had a -0.27 for both Angel City and Portland, which is something, considering she only played 4 games for Angel City. She is more aggressive in her dribbling than might be expected from the chart above as well, with 1.70 Take-Ons Attempted per 90 (83rd percentile), with 48.65% success rate.
Conclusion
Sugita’s Goals Added was -0.02, which is still good for the 83rd percentile. Only 4 Central Midfielders scored over 1.00, so it’s a hard position to add a lot of positive value. Still, I think that the model is undervaluing Sugita. She is positive in every defensive category except Aerials, but still gets a slight negative score defensively. And her Dribbling score cancels out the positives from her Fouling, Pass, Receiving, and Shooting. I personally don’t believe that her Aerials and Dribbling undoes all of the other good work that she puts in, so just focusing on that percentile score may be best.
In my mind, there is no question that Sugita is a good player, but that may be the wrong question to ask. I think she is also unquestionably the best midfielder that Angel City has, and perhaps has ever had. But is she truly world class, or simply quite good? She hasn’t really had the chance to be the star before, but she is now. Angel City acquired her for $600,000 as well as sending M.A. Vignola to the Thorns. I would value Vignola at $100,000 to $200,000, making the total deal worth around $700,000 to $800,000. Portland also let Sam Coffey go to Manchester City for about $875,000. For that high a fee, and the role than Angel City is asking her to take on, Sugita needs to be in the conversation for Midfielder of the Year. At Bayern Munich, Straus had Georgia Stanway, and that’s the level Sugita needs to play at.
I believe that she can get there. She has so many different ways that she can help the team, and I think that she can finish with 7-10 Goal Contributions, while providing the important connectivity to transition defense into offense, . But there are a few indicators that she’s not quite that player, most notably her Passing Completion Percentage and her Dribbling scores. She’s very good at finding productive passing, as well as creating goals from deeper positions, or getting into the box herself to score. This is her Age 29 season, and Sugita has had ten professional years now. The time is now for her to show that she is in this top tier of midfielders, and I think that her success and Angel City’s success will go hand in hand.
Players Not Evaluated
Lily Nabet played 1 minute of 1 match. She was later sent out on loan to Fort Lauderdale. Her contract expired at the end of the season, and she signed with Carolina Ascent.
Central Midfielder Conclusion
On the opening day of last season, Angel City started Hodge and Alanna Kennedy in the midfield, with Zelem, Hammond, and Lily Nabet on the bench. All five of these players have now left the team. I personally feel like Shores’ future is in midfield, but right now I don’t think there is anyone else to play left back. Martin and Sugita were both acquired via trade towards the end of the season. Ary Borges was signed as a free agent. I think of her primarily as a Ball Winner, but she does get into the box also, and had the 7th highest Goals Added of Central Midfielders (+0.52). Carina Lageyre also was signed out of Duke. Paul Harvey has her ranked has his 5th highest Holding Midfielder and 20th overall prospect, and she is likely the best college prospect that Angel City signed. Harvey gives her high marks for control, progression, and reactive defending, but less for 1 v 1s, proactive defending, and finishing.
I think that this is a group that definitely has talent, but there are two major challenges. The first is that pretty much every midfielder is being asked to take a step up and hit a higher level than they ever have before. I’m not against this, but it’s difficult for everybody to do it together. The second is that all of them are new to the team. It will take time to build that chemistry and understanding, and I’d ask all Angel City fans to have some patience for this process. That being said, I think that this group could still use an elite passer. I think that Shores could grow into that player, but there are a lot of variables that would need to fall into place to make that happen.
This midfield will be stronger than previous versions, but the biggest strengths are on defending and ball winning. Perhaps that’s the plan, and Straus is planning to concede a lot of possession and hit opponents on the counter. But I think that inevitably, there will be times when Angel City needs to control the tempo of the match. That is the job of the midfield, and while I think this group is an improvement, I also think that they need a little bit more quality in passing.
With the expenditure on Sugita, and with other needs at fullback and in attack, I don’t expect that we’ll see another big signing in this group. But on opening day last year, I definitely didn’t expect all of the central midfielders to be gone in a year’s time either.
Stats are from FB Ref and American Soccer Analytics. Some visualizations came from ASA, and are identified as such. All others are created by me.