ACFC Fullbacks 2025
Angel City has had a lot of turnover this year, so I’m not going to include any analysis on players that left mid-season, just to keep the focus on the team. However, I will include players that are (or may be) leaving as free agents. These will also be in order of minutes played, starting with the most, in each position group. I will not include players with less than 400 minutes played, as that is just too small a sample size.
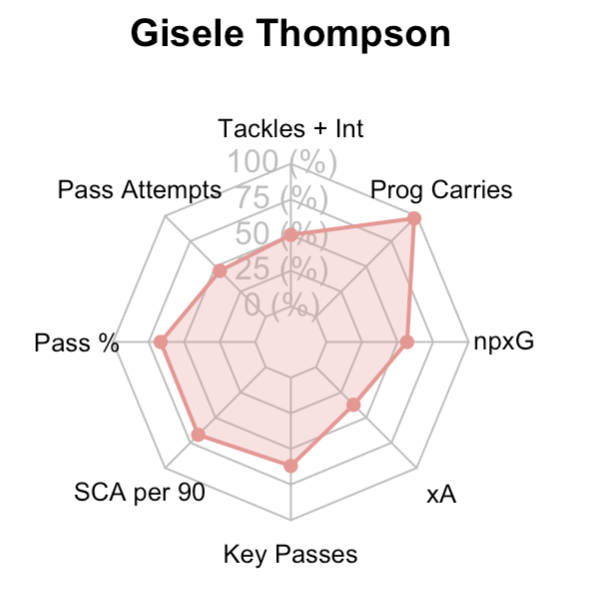
Radar plots are based on all NWSL defenders
There were a lot of talking points this season, but I think that it went under the radar just how good Thompson actually was this year. There was more of a focus on her sister leaving for Chelsea, or Angel City’s record, but this was quietly an amazing season. She finished 4th on the team in Goal Contributions (1G+5A). She played 1,657 minutes from 23 games (21 starts). This is almost double what she had in her rookie campaign in terms of both minutes and starts (882 minutes, 0G+1A, 10 starts), and represents a really big jump for her as a professional.
Playmaking and Goal Contributions
Thompson’s offensive stats are what is going to really grab the headlines. Her 5 Assists were tied for third in the league, only one behind Izzy Rodriguez and Delphine Cascarino, and her 0.27 Assists per 90 was fifth in the league. She also scored her first goal as a professional off a great pass from her sister that was probably my favorite moment of the 2025 season. It doesn’t look as great, though, when we dig into the numbers. Those 5 Assists came from just 1.5 xAG and 2.2 xA. The specific xG on her Assists was 0.04 (to Fuller at Portland), 0.1 (to Zelem at Washington), 0.04 (Tiernan v Louisville), 0.18 (Tiernan v North Carolina), and 0.06 (Shores v Washington). In just about every case, the goalscorer’s PSxG was significantly higher than what the position of the shot suggested. I don’t think it’s unreasonable to say that Thompson overperformed in Assists due to some lucky finishing.
What I find most interesting is comparing this season to her rookie season. Thompson’s xA per 90 remained exactly the same (0.12), while her xAG dropped in half (0.16 in 2024 to 0.08 in 2025). Yet her Assists went from 0.1 as a rookie to 0.27 last year. The next step is to examine her rate of Key Passes, and this actually went down slightly (1.53 to 1.41). This is not actually to say that any of this is bad. Among NWSL fullbacks, Thompson was still in the 59th percentile for xAG, 80th percentile for xA, and 94th percentile for Key Passes. Even with the overperformance, she was still above average, if not among the best, in playmaking categories.
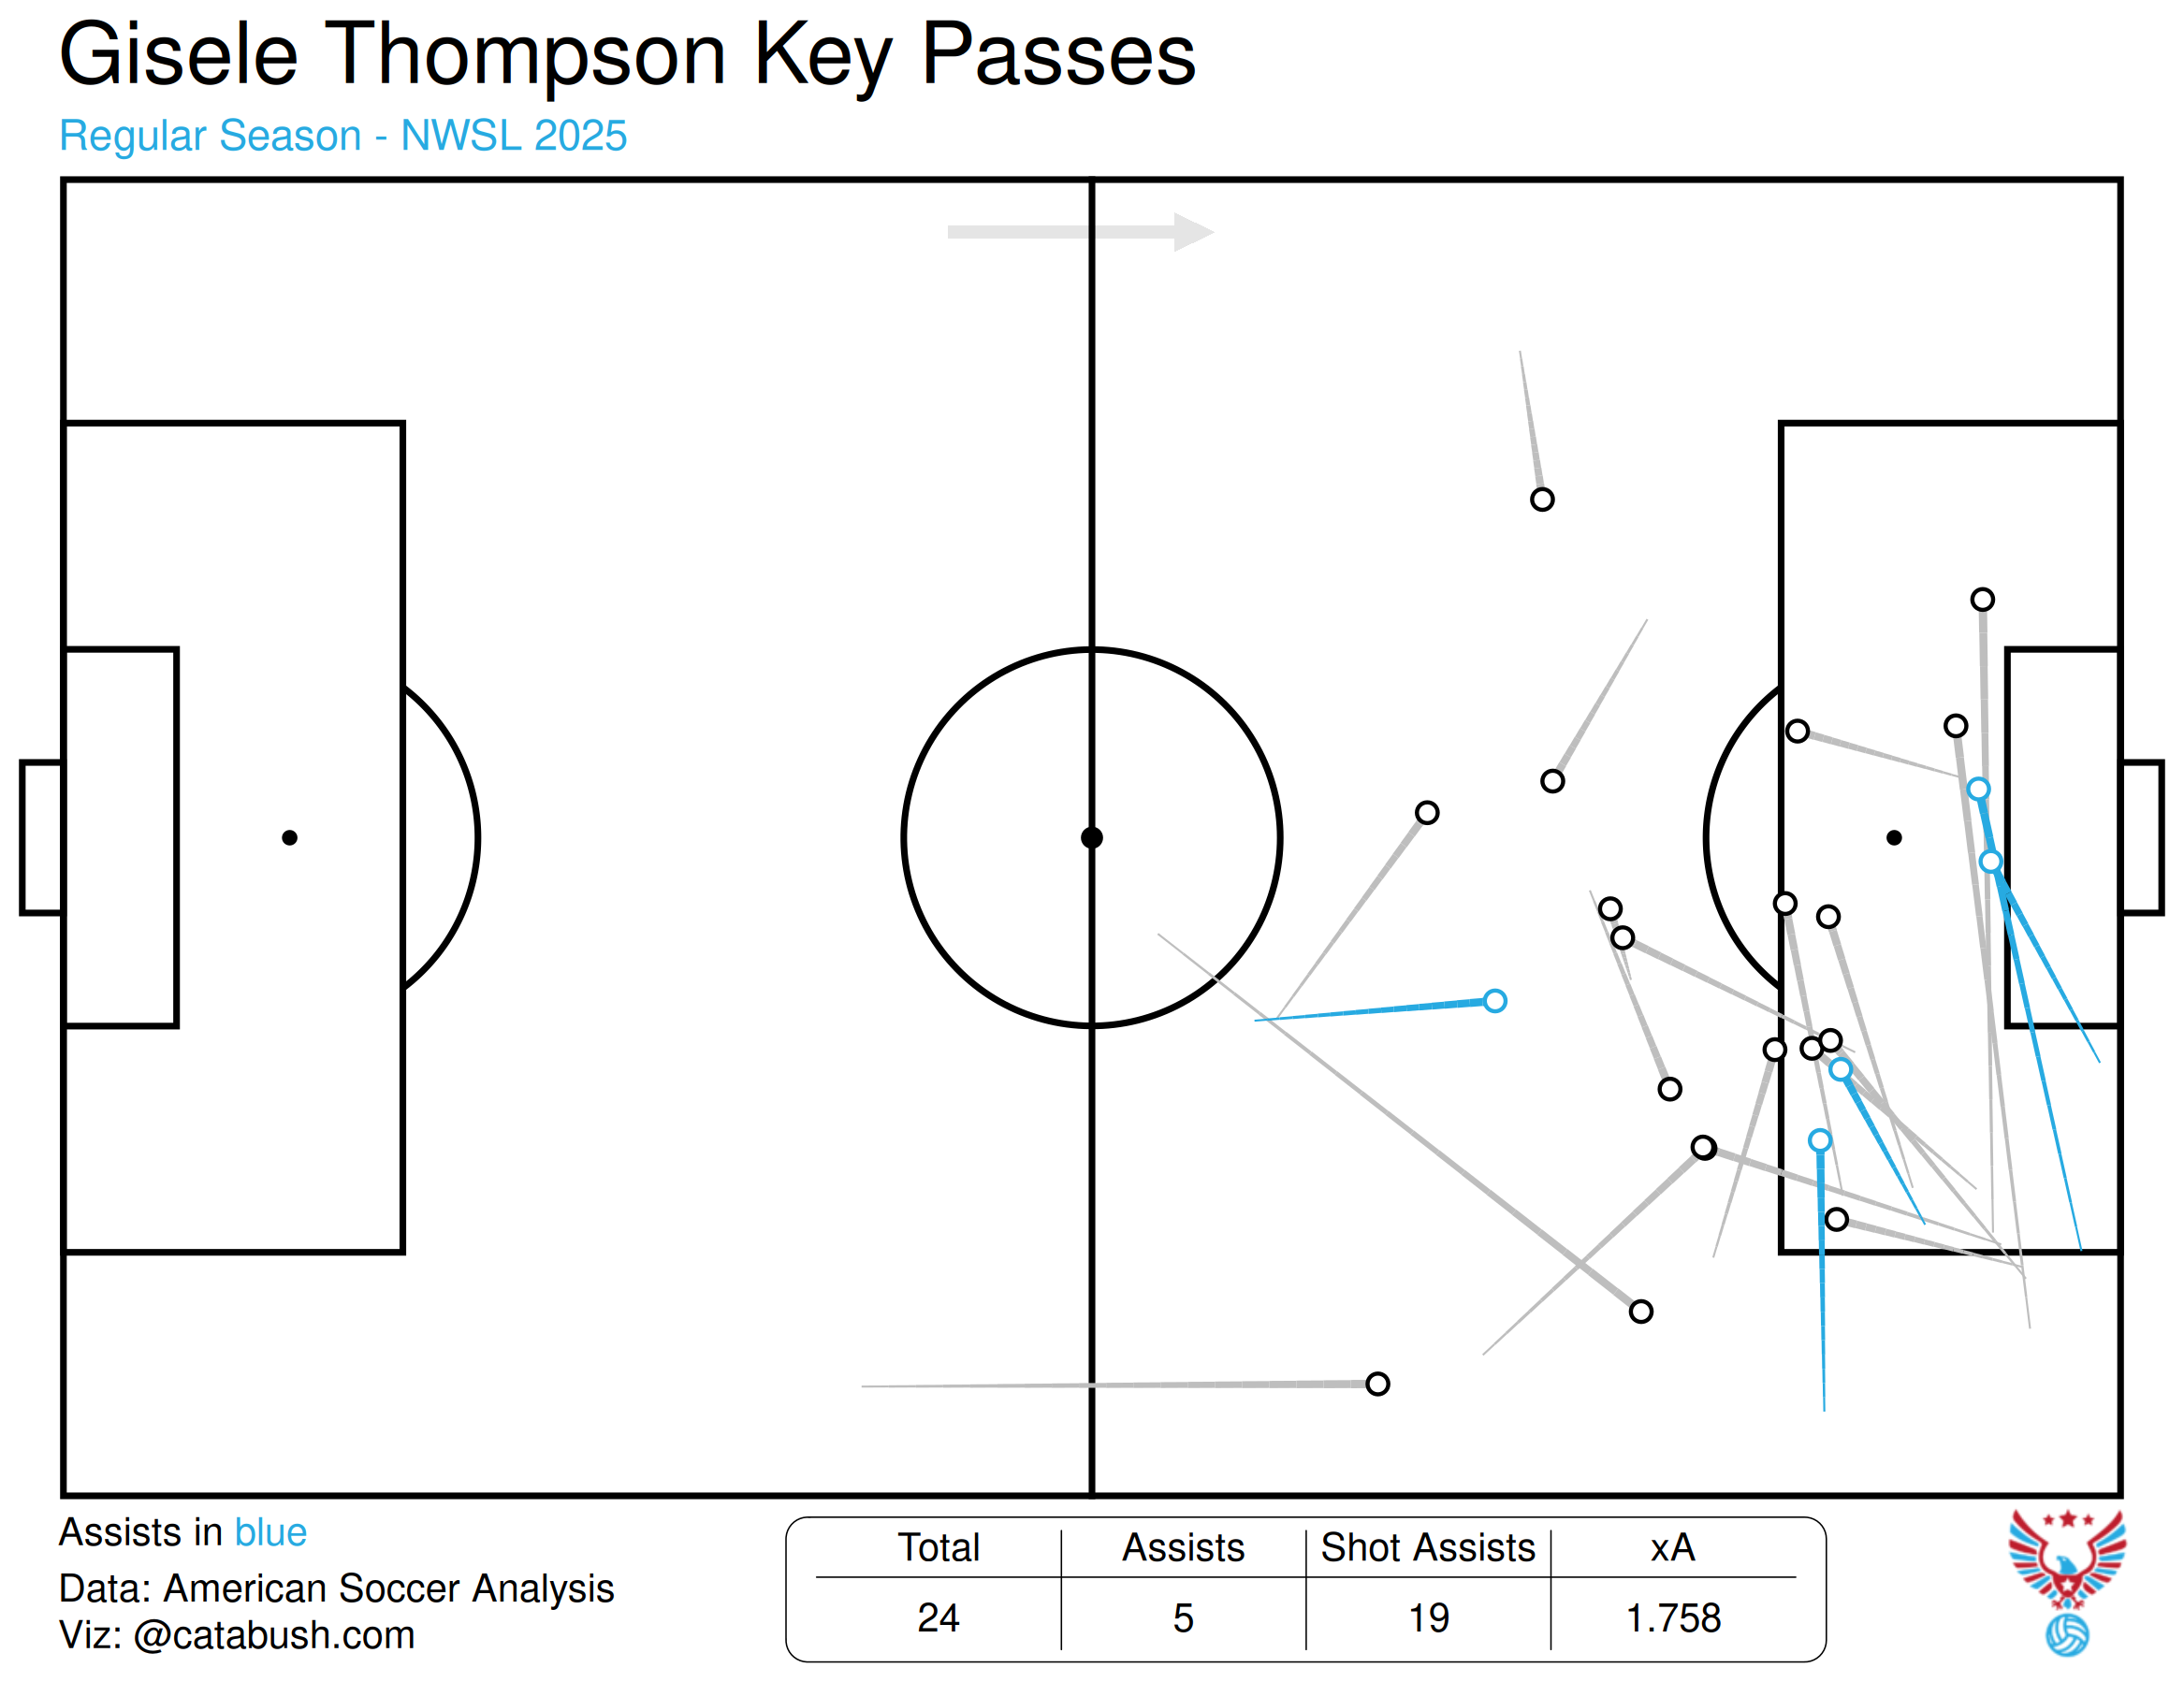
This graphic from American Soccer Analysis shows all of Thompson’s Key Passes for the season. We can see two of the Assists going to really dangerous areas, while the other three are not necessarily. What I really like to see in this graphic, though is that from around the same area, on the right side of the penalty box, we see passes to the far post and the near post, and both cutbacks and passes across the goal. So while Thompson got lucky with some assists, this type of passing should result in high number of assists in the future.
The other area of concern may be that Thompson only had 1 Assist after the summer break. Some of this may be attributable to Alyssa Thompson’s departure; simply her presence on the pitch created opportunities for all the other offensive players. But an interesting trend also emerges. Thompson’s Key Passes per 90 dropped from 1.33 in the first half of the season to 0.91 in the second half. But her Shots per 90 went from .5 in the first half to 1.0 in the second half. Thompson had 3 Shots in the first game of the season against the Wave, which accounts for half of her shots in the first half of the season. If we remove that one match, her Shots per 90 drops all the way to .27 per match. Part of this might just be a chemistry issue. I never felt like Thompson combined well with Jónsdóttir on the right. But I also think that with Alyssa’s departure, and goals for Angel City generally drying up, Gisele tried to take up that slack herself, resulting in more shots, and probably some that were ill-advised.
And while Thompson is in the 76th percentile for Shots and 90th percentile for Shots on Target, she is more middle-of-the-pack compared to other attacking fullbacks (8th out of 15, and 7th out of 15 respectively). Again, not bad, but not standing out from other similar players necessarily.
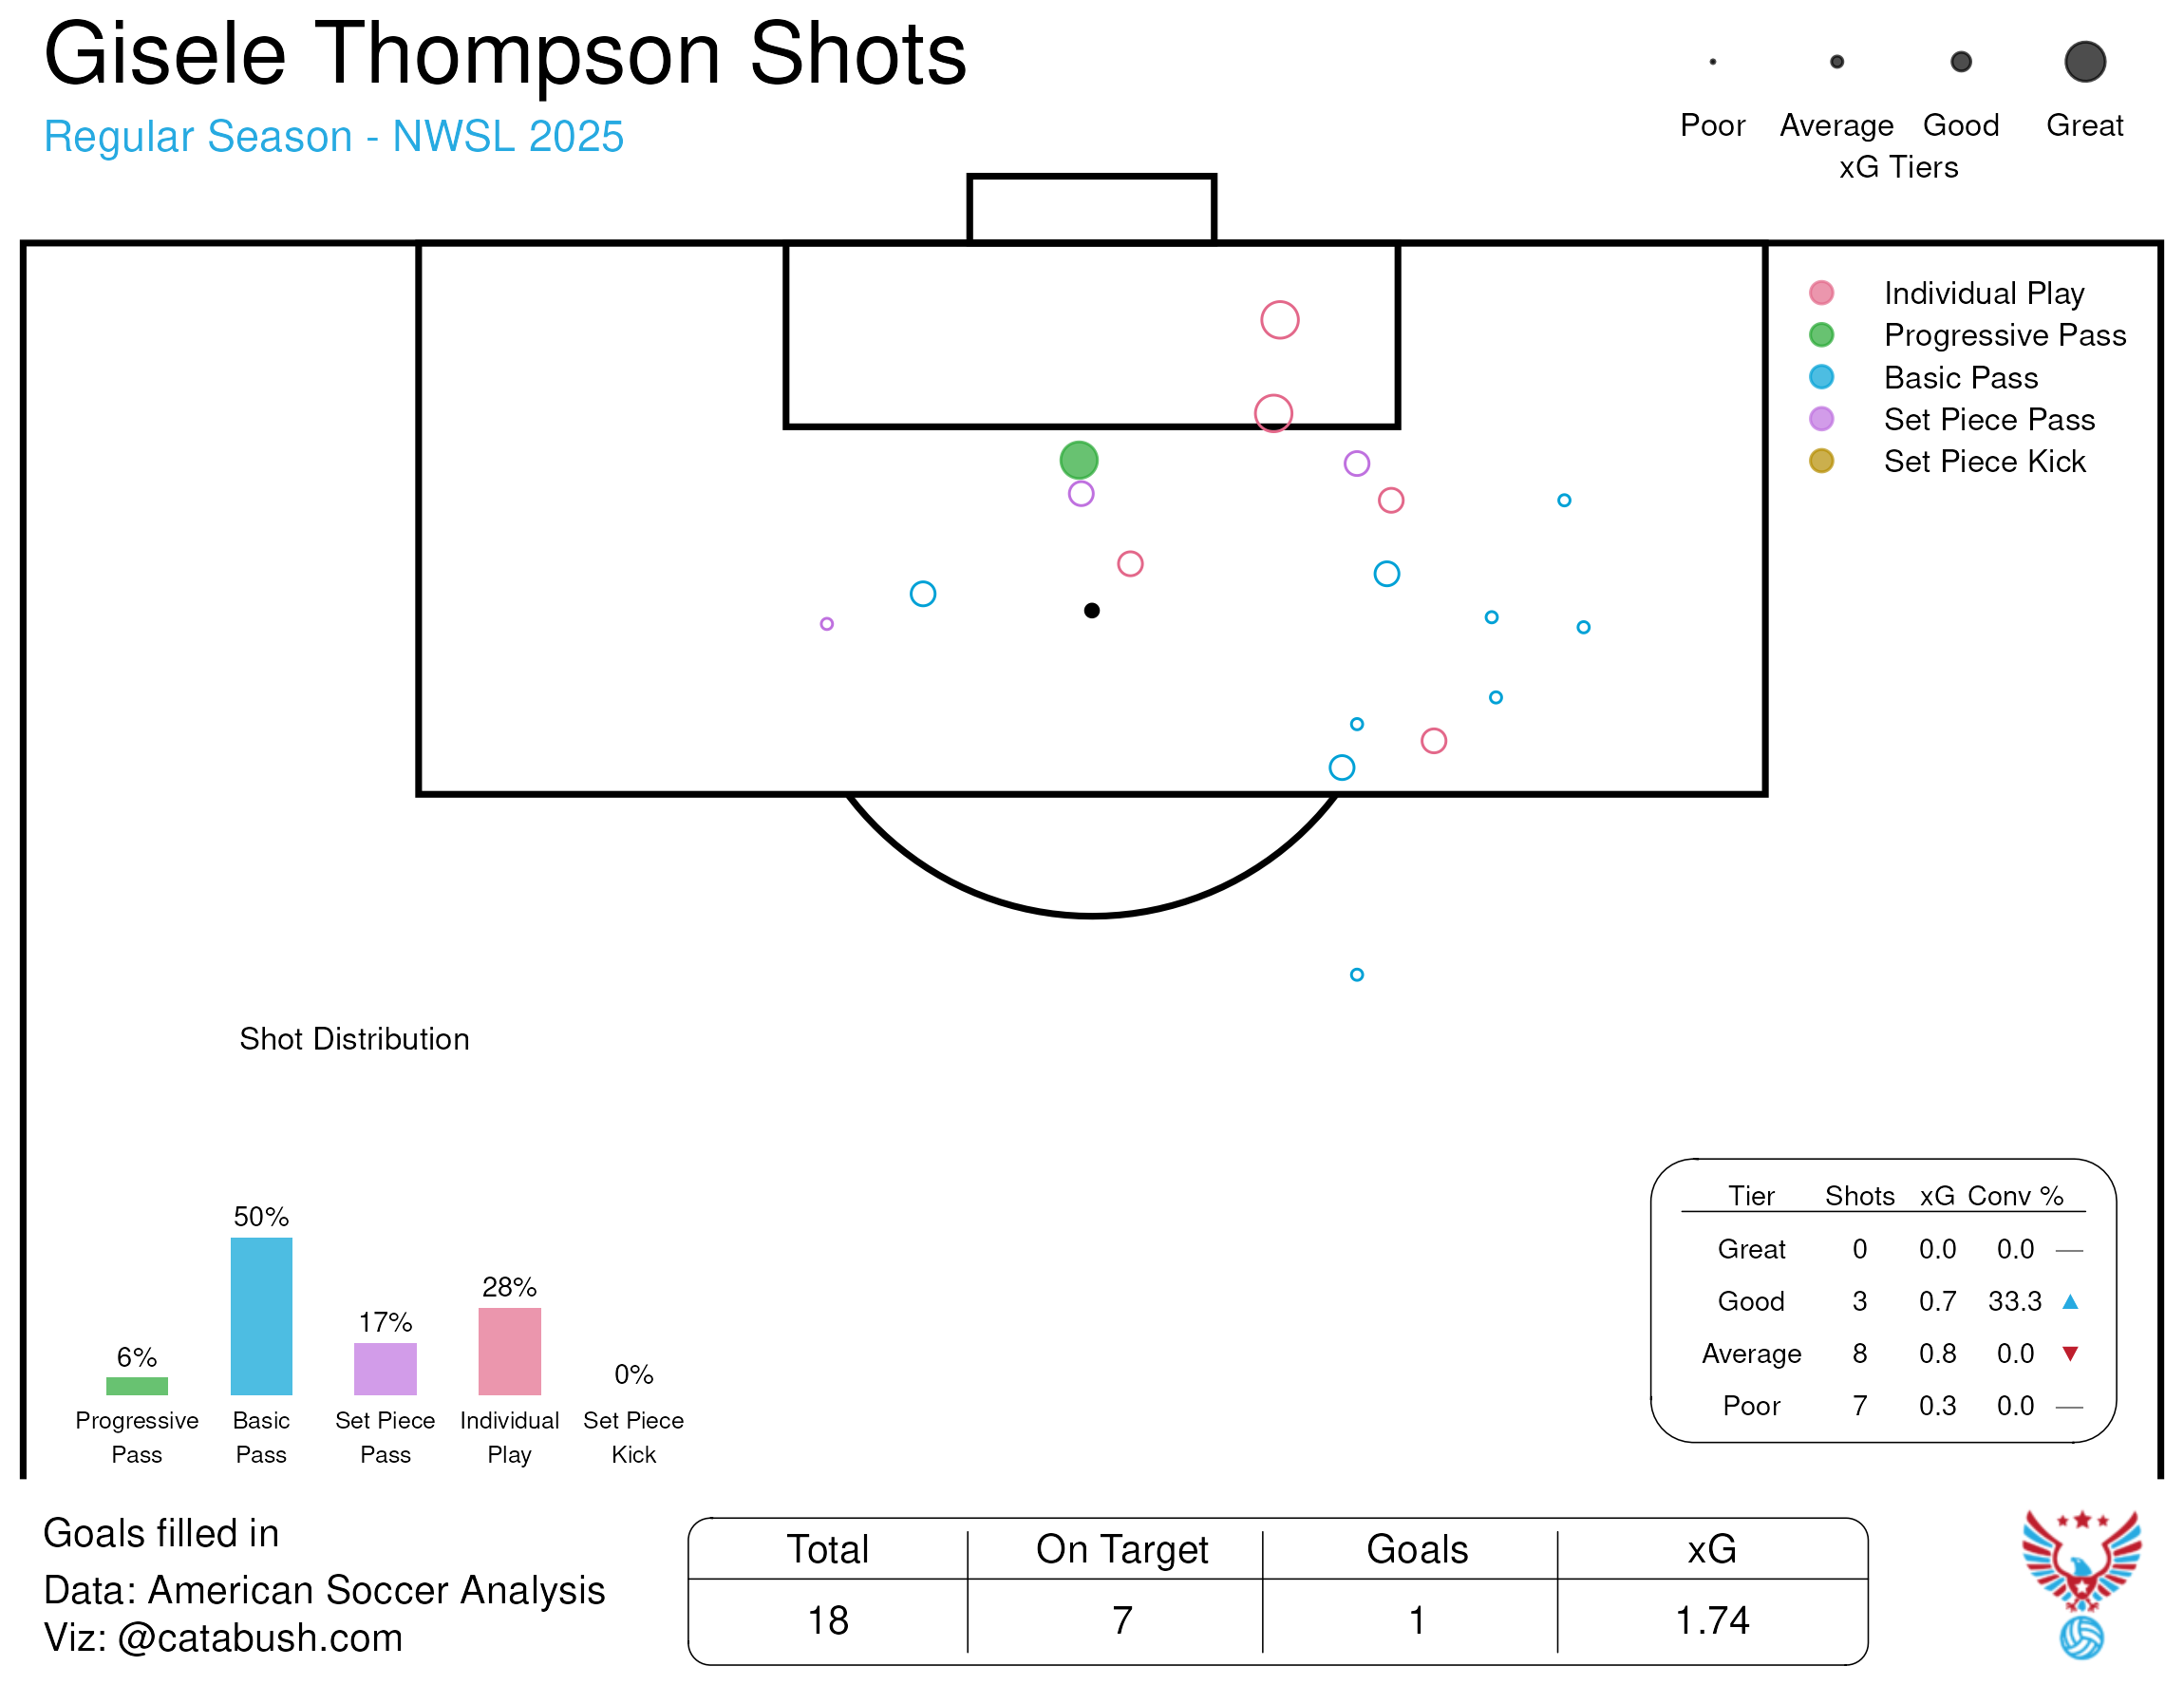
This graphic from ASA shows Thompson’s Shots, and we see that she missed two good chances, but 15 of her Shots were Average to Poor. Actually the fact that Thompson had a 41.2% Shot on Target Percentage speaks to her skill, but ideally, she should be taking higher quality shots to begin with. The other thing that stands out to me is that 28% of her Shots were generated from Individual Play, including those two Good chances that she missed. I think that this is an area in which she can improve, but also one that I think has some good signs and which I would expect to naturally see improvement.
Passing
While it’s true that Thompson was a difference-maker in the Attacking Third, her overall passing game could be more robust. Among the 15 attacking fullbacks I identified, Thompson was 12th in Total Pass Attempts. Among all fullbacks, that’s only in the 10th percentile, however her Completion Percentage of 81.8% puts her in the 94th percentile. Using ASA’s tables, Thompson’s xPass score of 34.45 was 5th among fullbacks, and her score of 5.11 per 100 minutes (just how ASA does it) was second among players with at least 700 minutes. She’s completeing more passes than the average player, but they’re not the most benefical passes. Switching to their g+ tables, or added goals per action, Thompson actually has the second best score among fullbacks (0.8, behind Avery Patterson). But this is largely on the strength of her shooting and dribbling, which we’ll talk about later. The g+ score from her passing was a -0.64, and there were only five fullbacks worse than that.
Not all of this is Thompson’s fault. As a team, Angel City has to do a better job of getting her the ball and presenting options for her. Thompson has the passing ability, as her xPass shows, but there often just isn’t someone to pass to. What Thompson can do, I think, is use her dribbling ability to support her passing. Again, we’ll talk more about her dribbling in the Possession section, but she often goes on long, slaloming runs. These have their place, but maybe there is also a middle ground where she dribbles a short distance to change her angle or open a passing lane, and finds the pass.
The other aspect to touch upon, that bridges passing and playmaking, is Shot Creating Actions. Again, Thompson is among the best in this regard: 94th percentile among all NWSL fullbacks for SCAs and 97th percentile for Live Pass SCAs. She had a total of 41 Live Pass SCAs for the season, of which 26 were Key Passes. It is worth noting, though, that these rates are also down from her rookie year (3.06 SCAs per 90 to 2.77). That doesn’t worry me too much, as I think that there is going to be a slight drop with more minutes, as well as the fact that she had a higher proportion of minutes at forward in 2024. Looking at my group of attacking fullbacks, only Janine Sonis (who also played a significant portion of the season at forward) and Izzy Rodriguez (who had the advantage of playing with Chawinga, who can turn almost any pass, anywhere on the field into a Shot Creating Action) had a higher SCA per 90 than Thompson.
This reiterates my feelings above that Thompson’s below average passing stats are a factor of team play. The attacking third is the most congested area to make a pass, and these passes also have much higher g+ values. The fact that Thompson is among the best in this regard, but among the worst in overall Passing g+, means that her other passes have to be carrying substantial negative value. If she can find the more difficult passes, I think that it stands to reason that her lack of productive passing in the buildup is due more to options and less with her decision making. And I think that the eye test also bears this out.
Defense
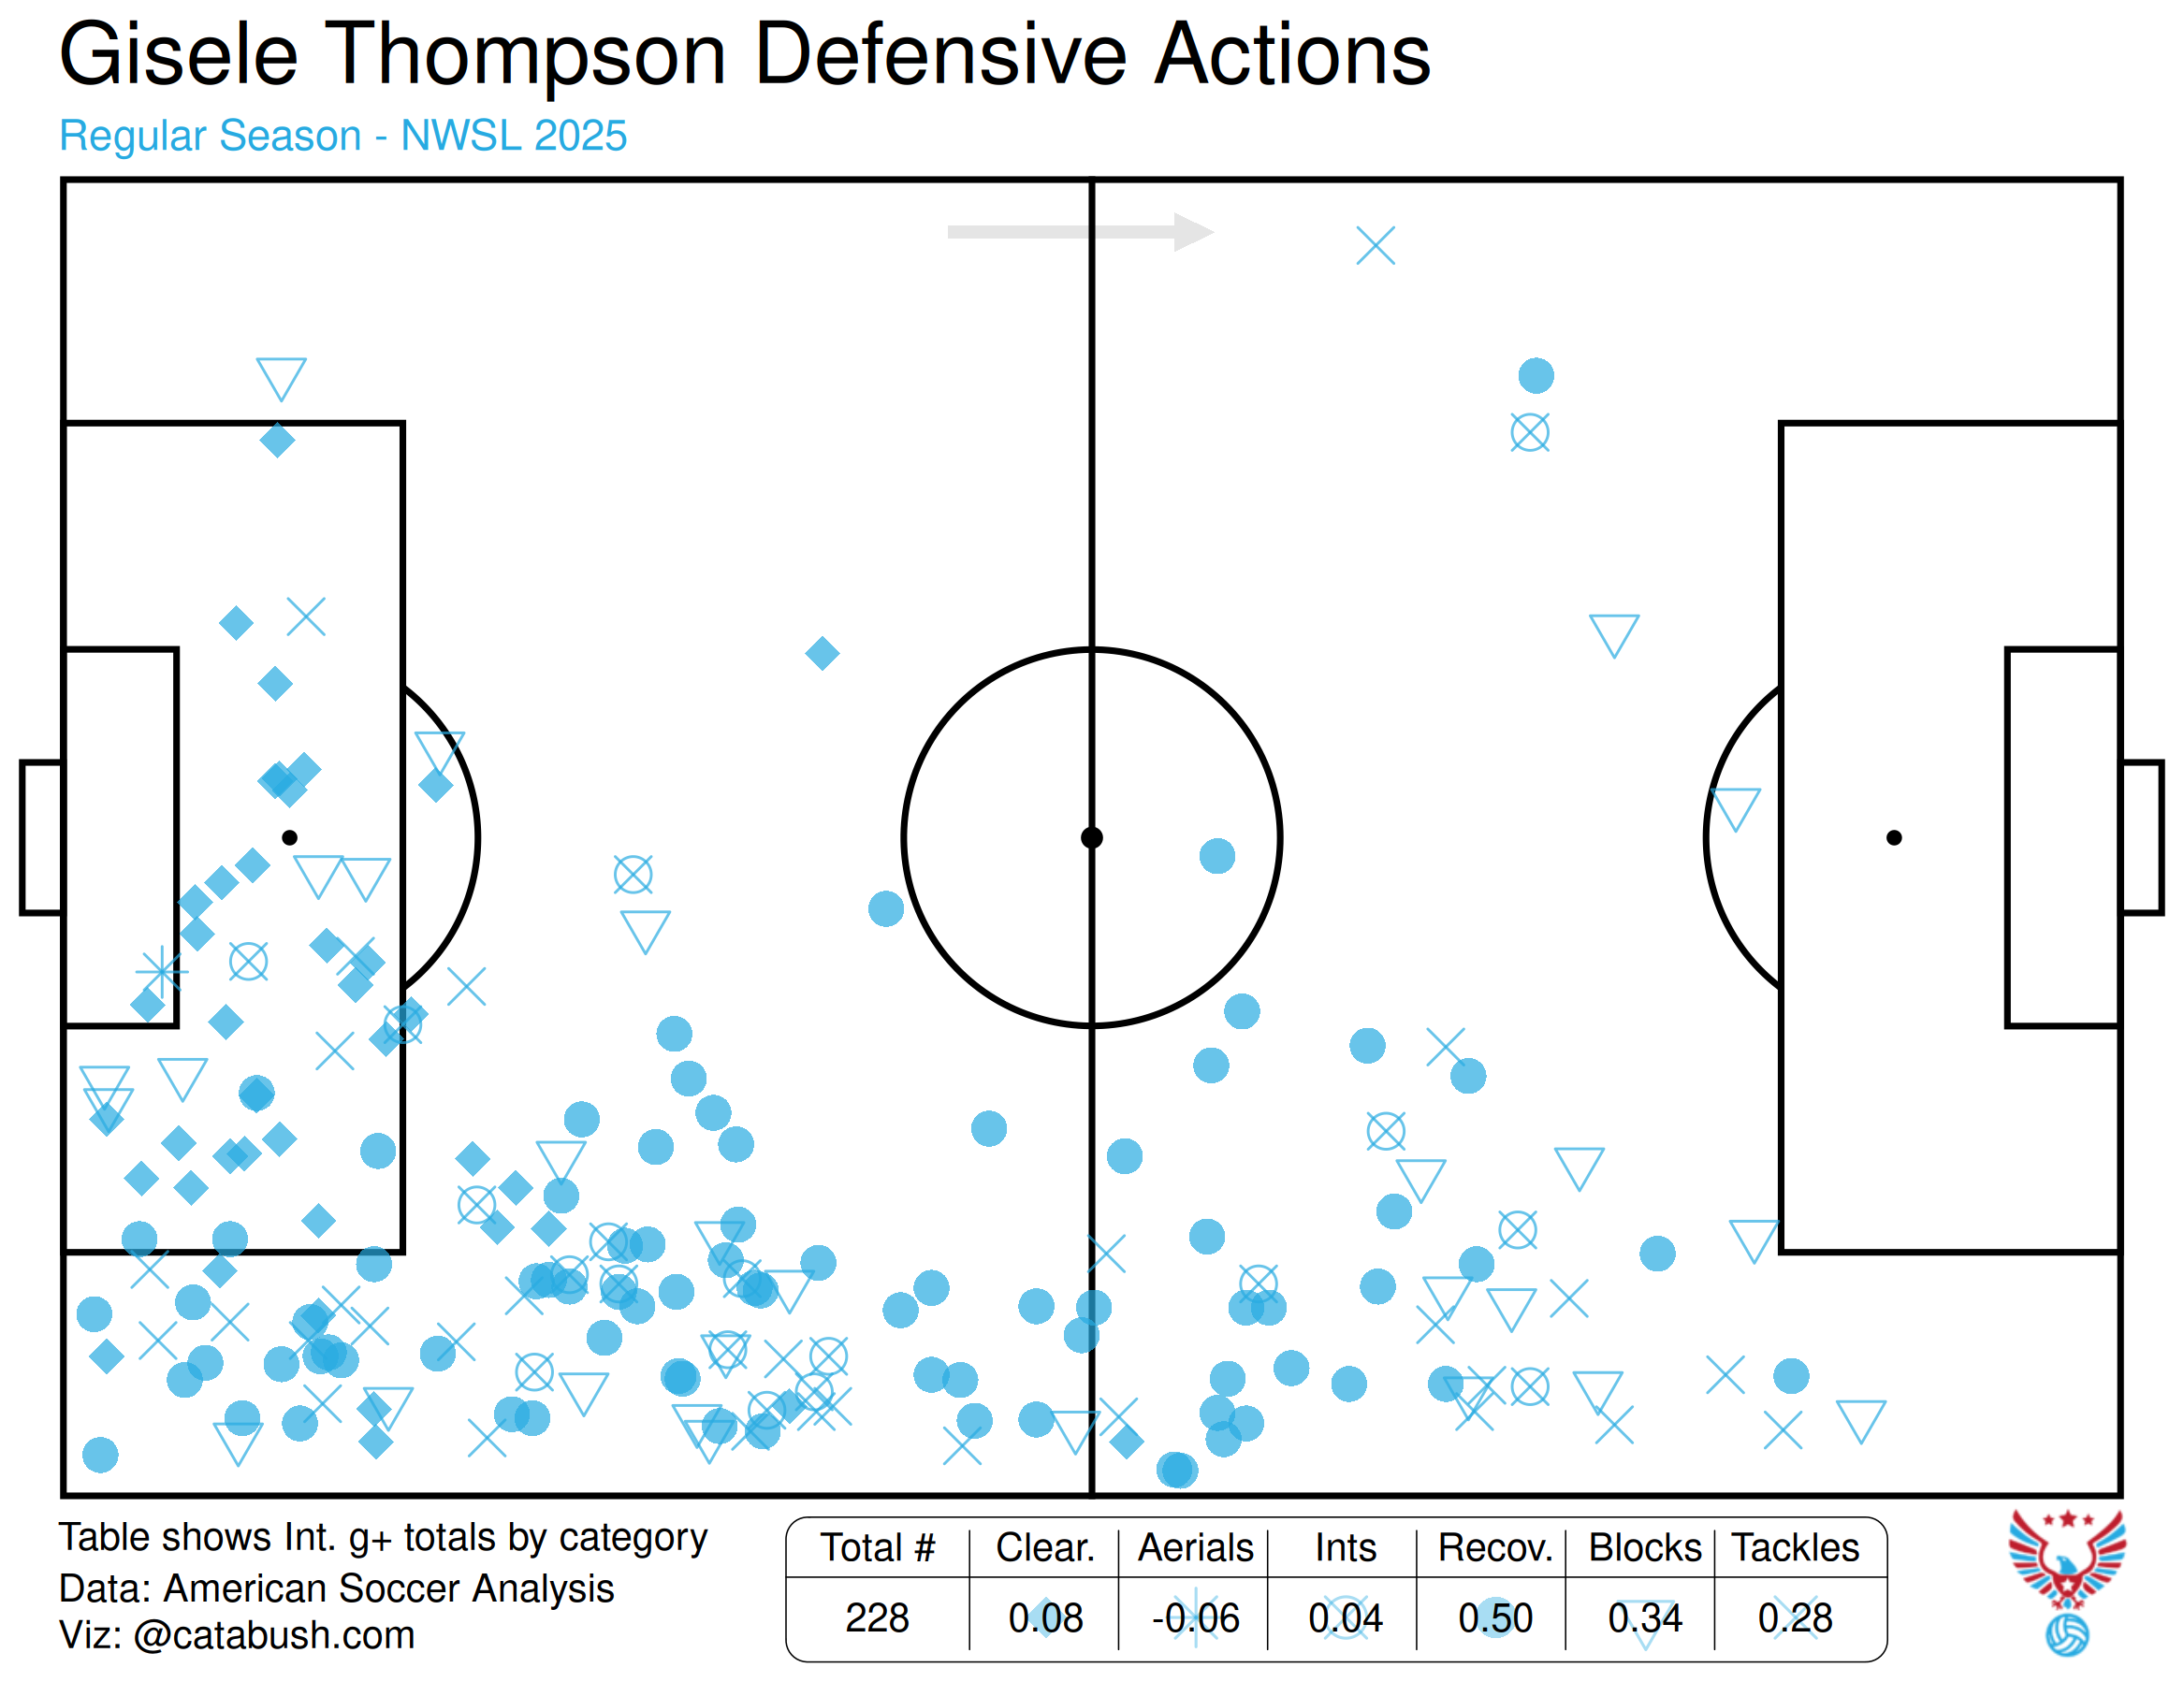
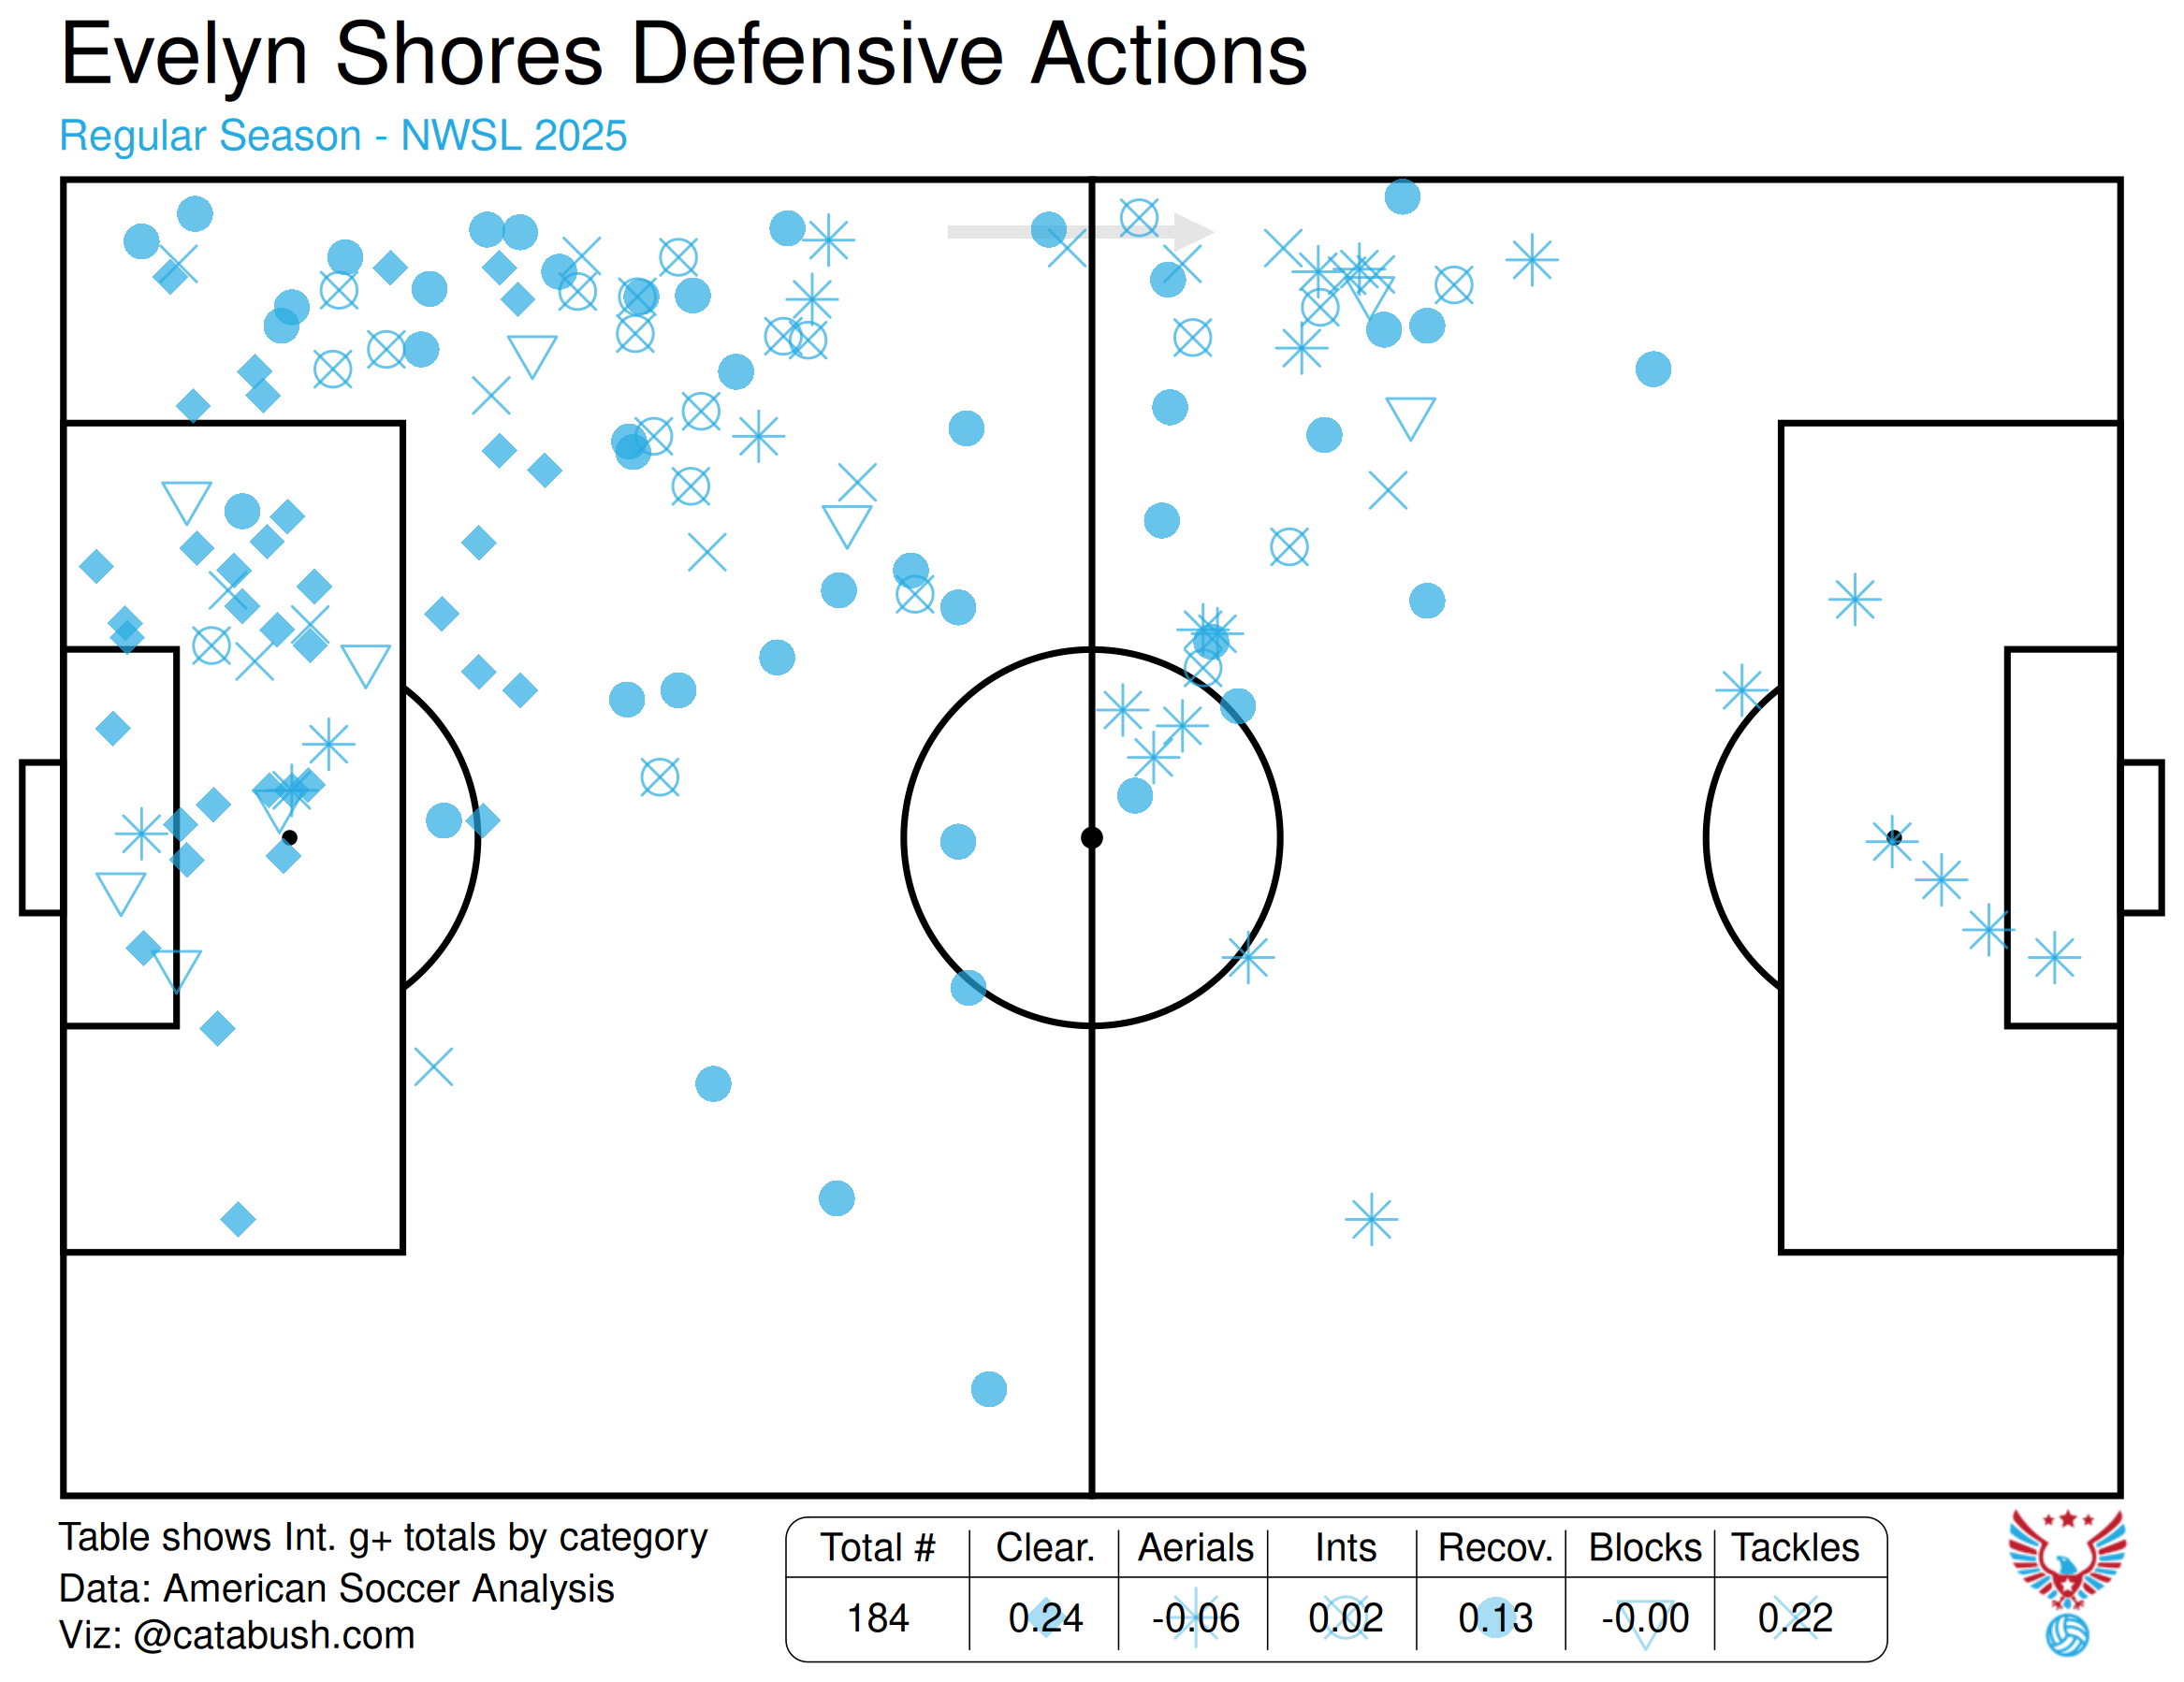
This might be the area in which Thompson really separates herself from her peers. Thompson’s defensive statistics are sterling, especially amongst attack-minded fullbacks. She was in the 90th percentile of all fullbacks, but among the players I identified as attack-minded*, Thompson had the highest rate of Tackles per 90 (2.88), and the third highest rate of Tackles + Interceptions per 90 (3.85), behind Avery Patterson and Kate Weisner. What makes the Tackles stand out even more is that they are not all just in one area of the pitch. Her per 90 Tackle rates are 1.12 in the Defensive Third, 0.92 in the Middle Third, and 0.76 in the Attacking Third. That Attacking Third mark is especially remarkable, as Maddie Dahlien (who is more forward than defender) in second place only has 0.49, or 32% less than Thompson. No other fullback was even close to Thompson in this regard. And looking at the rate of Challenges Lost, Thompson was also the best fullback in the league at. 0.05. The following graphic from ASA shows her defensive contributions all up and down the pitch.
Possession
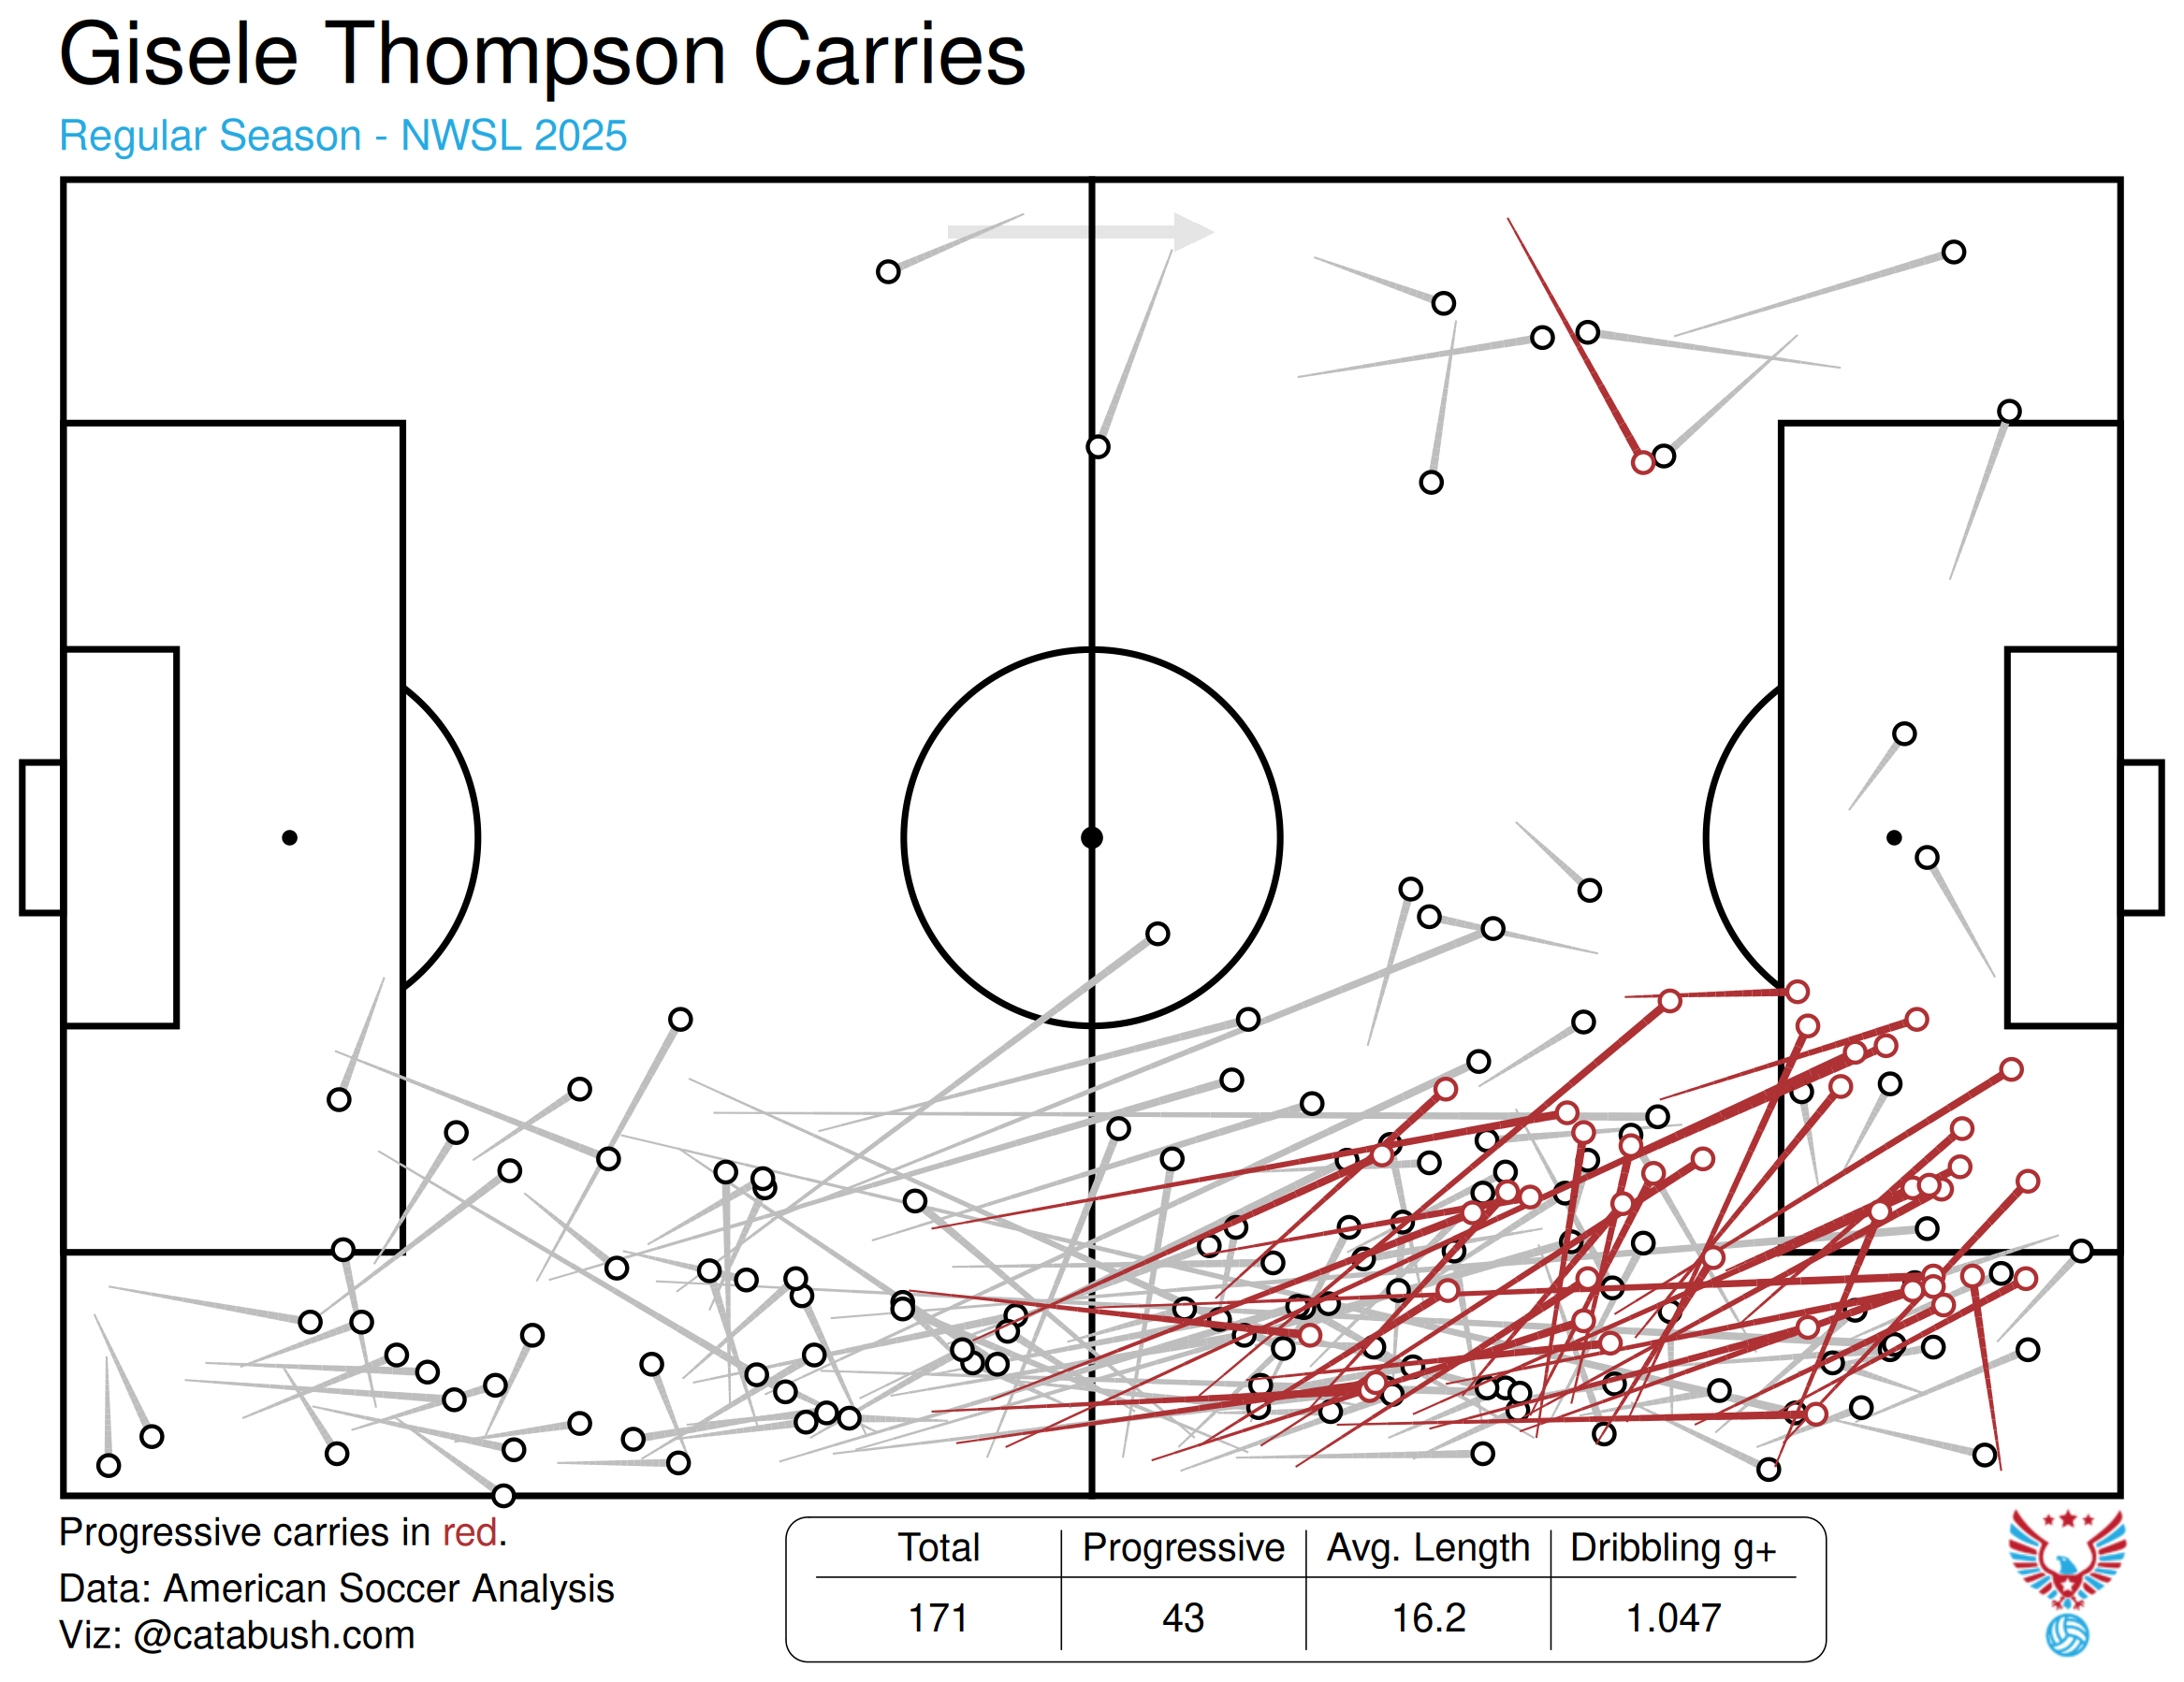
This is an interesting contrast of extremes. Thompson is only in the 15th percentile of fullbacks for Overall Touches, but the 97th percentile of Touches in the Attacking Penalty Box. She is in the 17th percentile for Carries, but 69th percentile for Carry Distance, and 92nd percentile for Progressive Carry Distance. As I mentioned earlier, Thompson tends to go on long dribbles up the field when she commits to carrying the ball. In fact, only Janni Thomsen has a longer average carrying distance amongst all defenders, not just fullbacks. In terms of Take-Ons, Thompson is slightly more subdued, ranking in the 62th percentile for Take-Ons Attempted, and 73rd percentile for Successful Take-On Percentage (53.6%).
Conclusion
Thompson signed a contract extension during the season that takes her through 2029. I know that not a lot of Angel City fans are optimistic that she will actually play out the entirety of that contract, but that length is important. I think that Thompson took a step up in adapting to the rigors of playing at the professional level this year. She overperformed her Assists, but underperformed her Goals. With the expectation that Angel City will have a better attack in 2026, I’m optimistically predicting 10 goal contributions next year for Thompson. I believe that her xA will increase, leading to around the same 6 or 7 Assists, but she will also increase her goal scoring, getting around 3. As it is, I would consider Thompson to already be one of the best right backs in the NWSL, with only Patterson clearly above her, but also considering Mace, Bruninha, and others. With more involvement, Thompson can put this debate to rest, standing alone as the best and a unique weapon for Angel City. But she absolutely needs to find a way to be more involved in the build-up, while also maintaining impact in the attacking third.
* This is based on K Means clustering that I ran for NWSL defenders. There were 5 clusters generated, and I’m including those considered Creative Fullbacks and Attacking/Inverted Fullbacks. Together, both groups constitute 15 players.
In her first season with Angel City, Moriya played in 25 matches, with 13 starts, for 1,423 minutes. This was the 6th most minutes of any ACFC player.
Passing and Playmaking
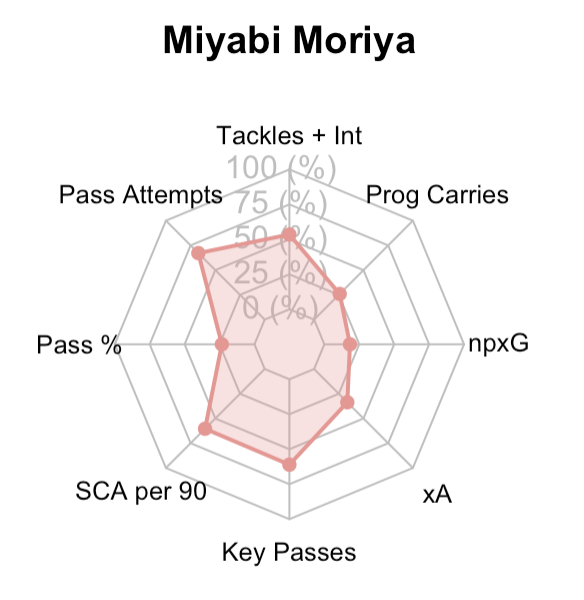
On the radar plot above, the two things that really stood out to me were how low Moriya’s pass completion was, as well as how high her Key Passes and SCA’s were, so I will start with these factors. Breaking down Moriya’s passes by length, her Short Passes percentage was 82.3% (23rd percentile), which is obviously below average, but only 2.5% below average. For her average of 23 short passes a game, that’s maybe only one extra pass not getting completed. With Medium Passes, though, Moriya’s completion percentage drops 71.2% (6.7% below average and 13th percentile). Her Long Passes percentage dropped to 38.1% (7.9% below average and 15th percentile). That all combines for a 69.6% Pass Completion Percentage and puts Moriya in the 22nd percentile. From ASA’s tables, Moriya’s xPass score is -5.58, and her g+ score from Passing was -.26. While neither is the worst, negative scores are clearly not good.
From the eye test perspective, I never thought of Moriya as a sloppy passer, though her passing range never really jumped out at me either. Part of that, I think, is that this was her first year in the NWSL, and there were definitely times that it didn’t look like she was on the same page as her teammates. It’s a big change, coming not just to a new team, but a new league and country, and I think that some grace needs to be given in this regard.
The volume of passing is also of note, especially compared to the previous discussion on Giselle Thompson. While Thompson was averaging 36.5 Passes per 90, Moriya was averaging 49.9. Among players with at least 500 minutes, Moriya was 6th on the team on Passes Attempted, while Thompson was 13th. This put Moriya in the 71st percentile of all fullbacks. Part of that, though, is that Moriya took more dead balls. She had 12.8 Dead Ball Passes per 90, most on Angel City, while Thompson only averaged 7.12.
But while my impression of Moriya’s passing may have been overrated, I viewed her as a decent, but not great, contributor on offense, and that may be underrated. Her overall Shot Creating Actions (SCAs) were in the 83rd percentile (2.47), while Live Pass SCAs were 78th percentile (1.71). Her 1.39 Key Passes per 90 were in the 92nd percentile. xA (0.11) and xAG (0.12) were in the 76th and 87th percentiles, respectively. This didn’t actually translate to the scoresheet, though. Moriya had 2 Assists on the season. One was from a corner kick to Niehues v Bay FC and the other was to Jónsdóttir at North Carolina after a nice giva-and-go with Endo. In fact, these two Assists were the only two of Moriya’s 39 SCAs that became Goal Creating Actions. Right now, I don’t think that we can answer if this is due to poor finishing, bad luck, or if Moriya actually wasn’t generating great chances. But maybe the answer is somewhere in the middle; the chances created were a little overinflated, but the actual goal contributions were a little unfair. Which would bring us back, full circle, to my initial assessment that Moriya was decent, but not great, in her playmaking.
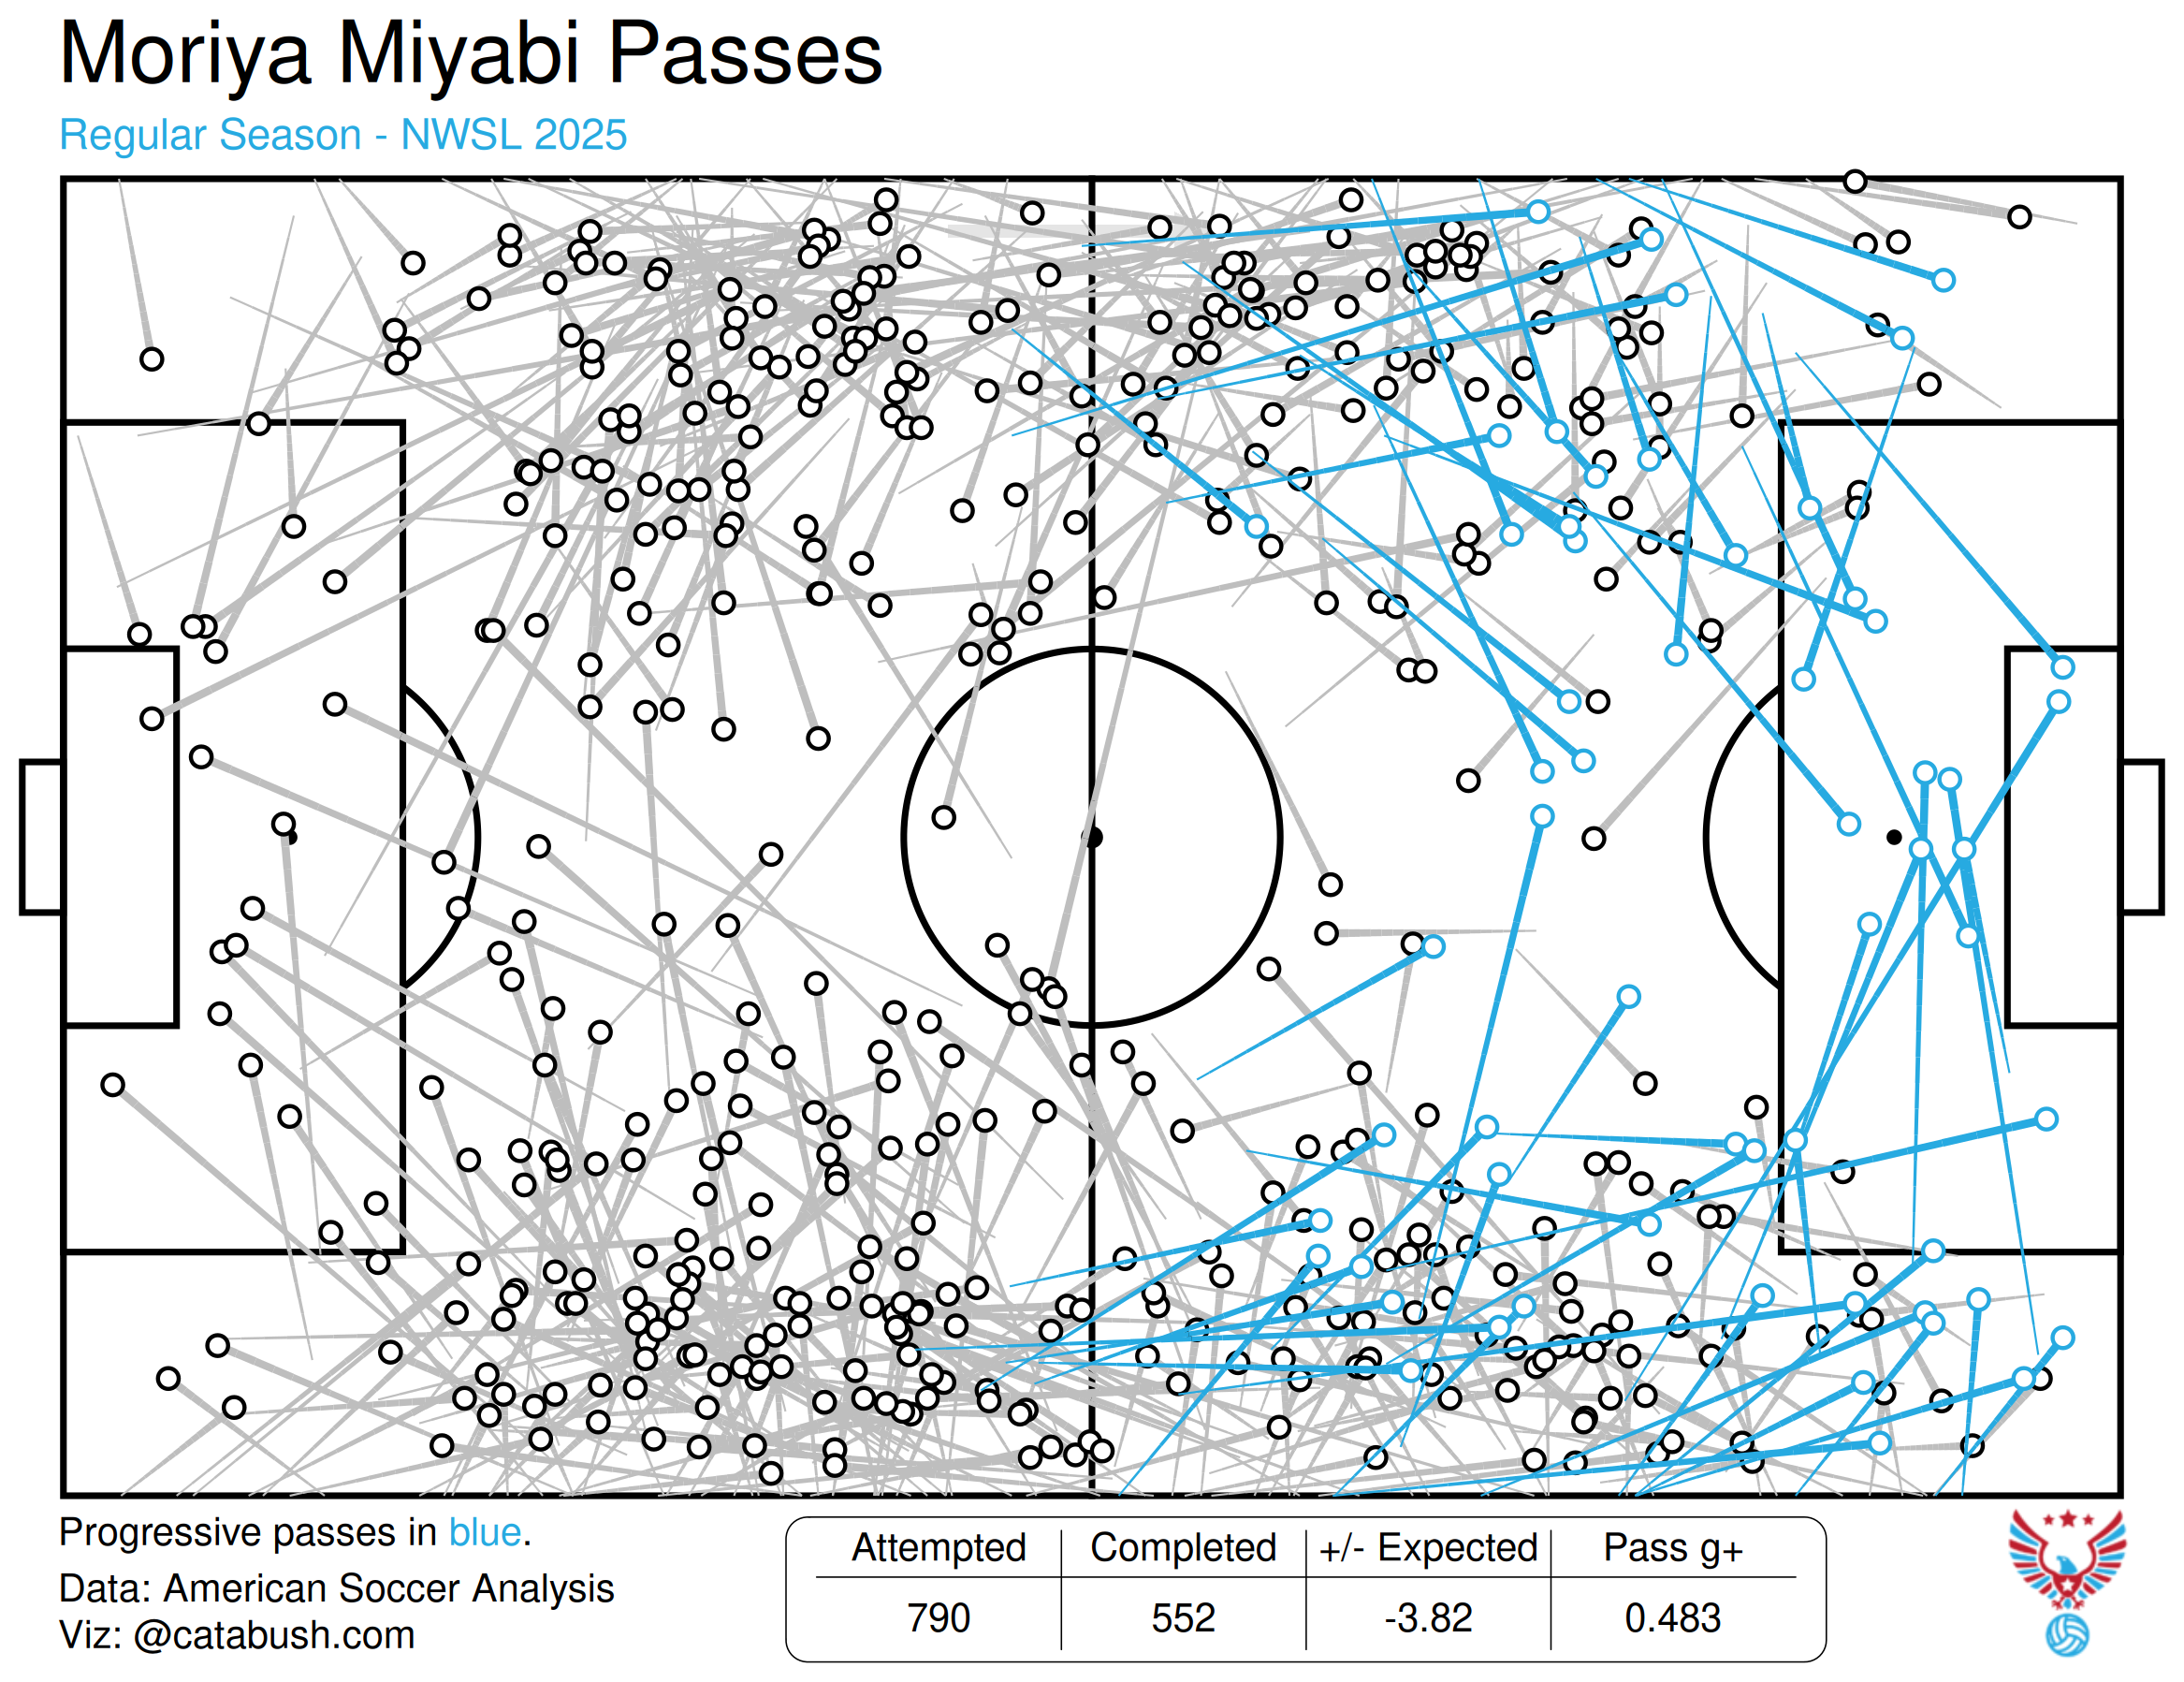
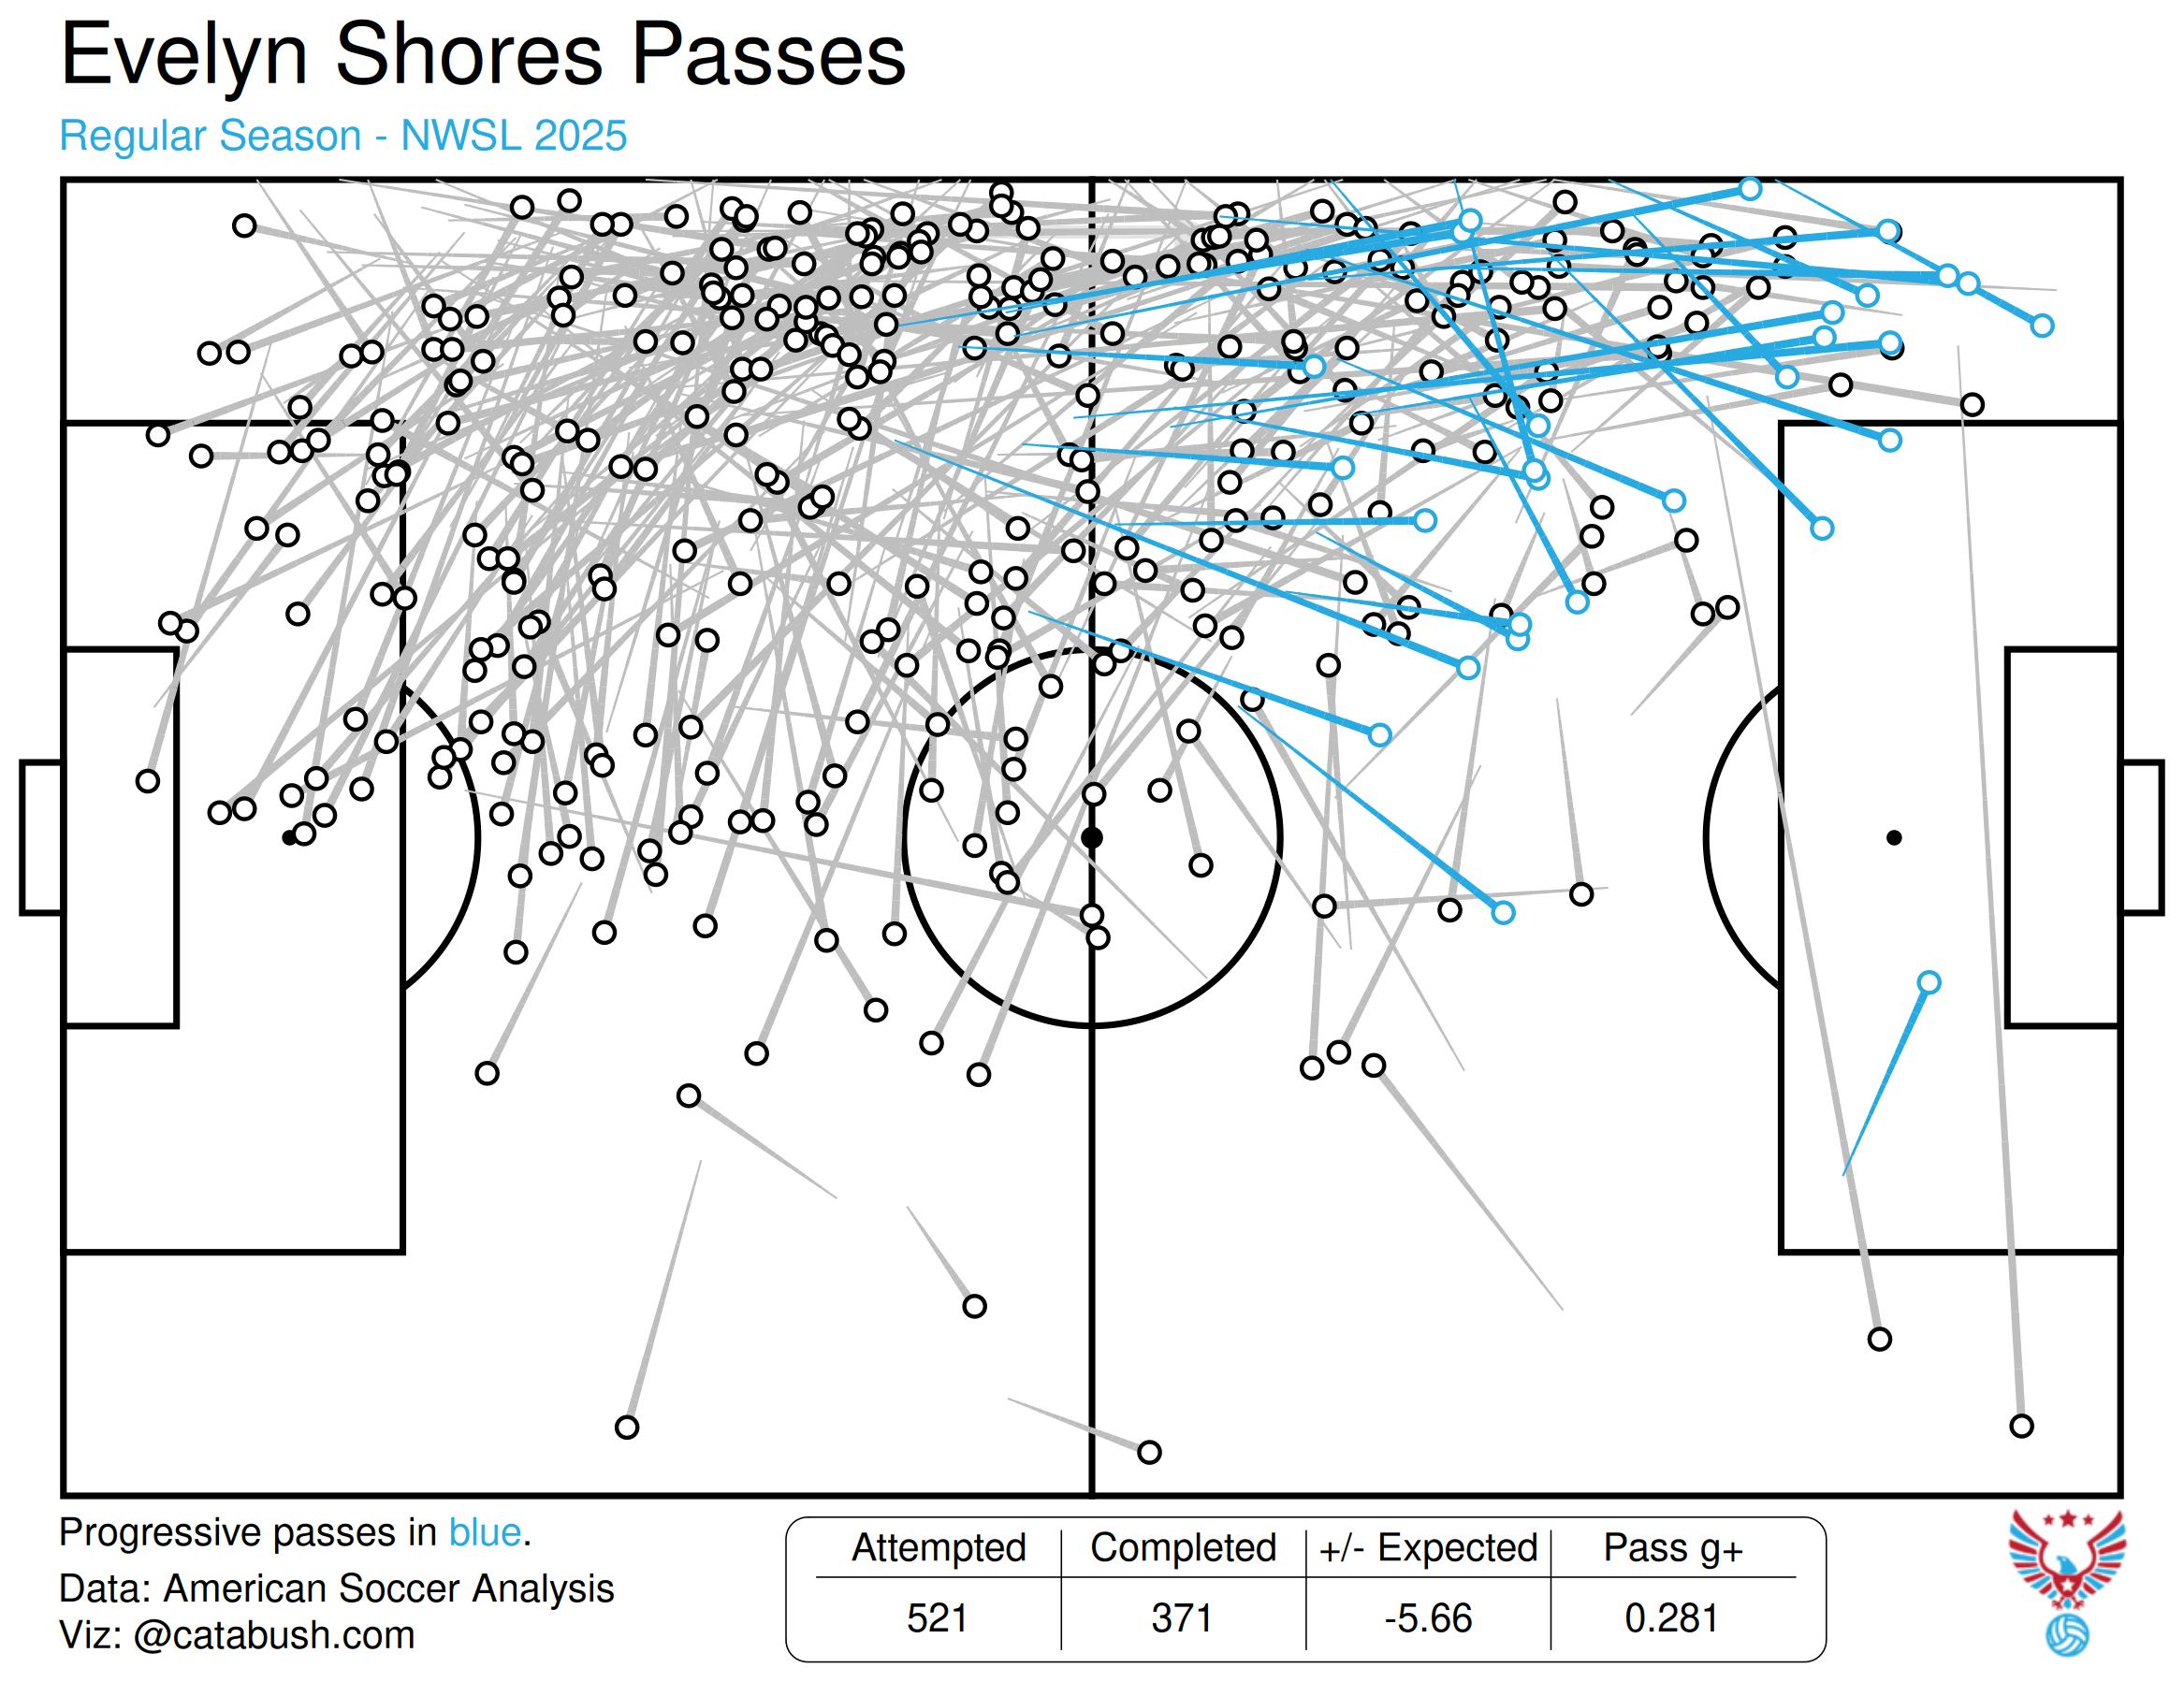
ASA’s graphic above nicely showcases Moriya’s passing, I think. In her own half, it’s almost all backwards and lateral passing. When the team is able to break the first line, and move the ball into the opposition half, than Moriya is able to progress the ball. Only 8.9% of her Completed Passes were considered Progressive Passes, however. In the K means clustering I ran, Moriya was categorized as a Box-to-Box, or all around defender. Think Hanna Lundkvist, Cori Dyke, or Ryan Williams. And I think that this passing chart absolutely demonstrates that; almost every pass Moriya makes originates from between the boxes.
Defense
Defensively, I thought that Moriya looked strong, especially for being brand new to the league, and her stats backed that up: 94th percentile in Tackles (3.1 per 90) and 97th percentile in Blocks (1.71). Her Interceptions were lower (0.95 per 90, 34th percentile), but the overall picture is of a player that is making stops. However, ASA’s data disagrees. with Moriya having the worst g+ score in Interrupting (-1.19) and Fouling (-0.22). In other words, the sum total of Moriya’s defensive work was that the opposition got almost 1.5 more goals than should be expected. Perhaps part of this is Angel City’s defensive structure. There has always been an emphasis on fullbacks engaging attackers at ACFC, regardless of coaches, with Gisele Thompson and Moriya leading the team in Tackles in 2025 (with Vignola in 3rd), Curry and Spencer in 2024, and Ali Riley in 2023. So perhaps Moriya was simply in the position of making a high volume of defensive stops, but the actual work of those was not beneficial. For instance, the high rate of blocks, but low rate of interceptions supports this, as consistently being between an attacker and the goal can lead to getting blocks, and while it’s good to break up the opposition’s passing, it’s even more advantageous to win the ball back and turn defense into attack. Thus, continuously making stops, but not winning possession, can lead to very high rates of defensive statistics, but not much actual value.
One final argument, though, in favor of Moriya, is that it’s not like she was just sitting back defensively the whole time, letting attackers come at her in waves. She is in the 90th percentile of fullbacks for Tackles in the Defensive Third (1.90), but she is also in the 76th percentile for Tackles in the Middle and Attacking Thirds (0.82 and 0.38). ASA’s chart of her defensive actions is below.
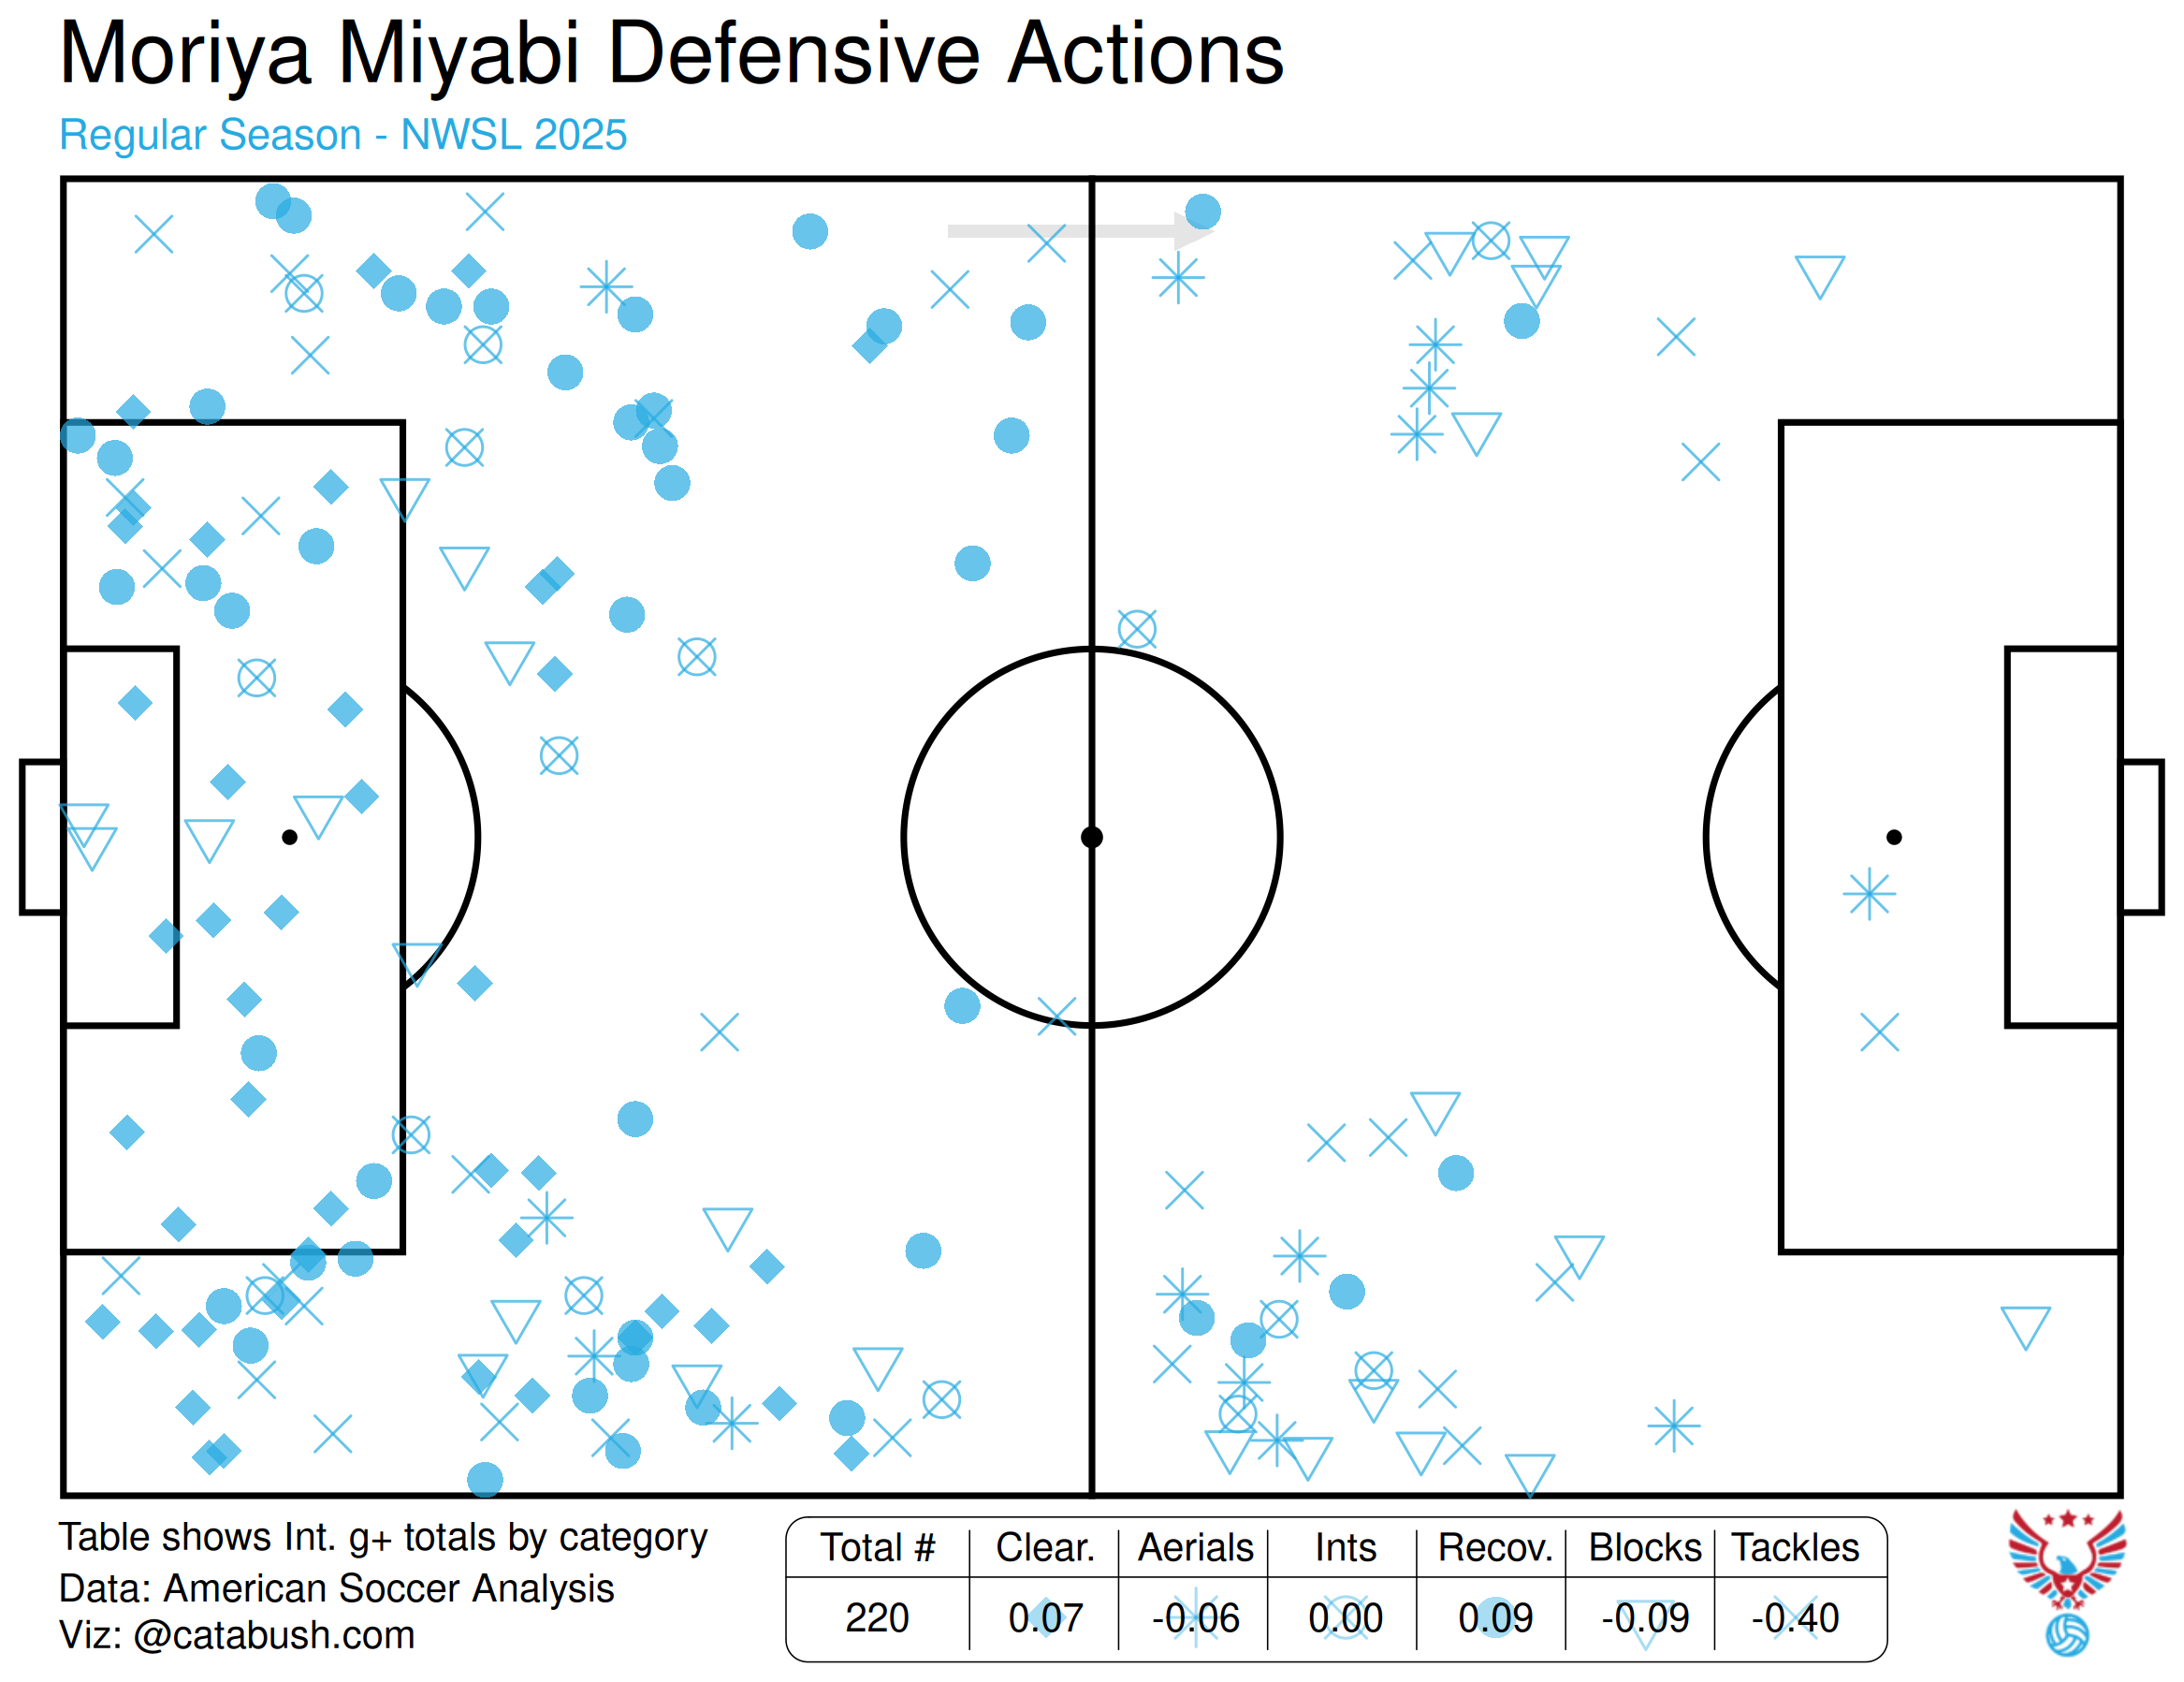
I think that this does demonstrate that she is making stops all over the pitch. My personal feeling is that once again, the truth lies in the middle. I don’t think that she’s the worst fullback defensively, as ASA’s tables seem to suggest, nor do I think that she is at an elite level, as her tackle percentile seems to suggest. I don’t think that she’s the kind of shutdown defender that can keep her winger locked up all game, but I don’t think that she’s a liability either.
Possession
As we discussed earlier, Moriya had a higher passing volume than Thompson, so as we expect, she also has a higher number of Touches, an average of 62.49 (71st percentile). Maybe what surprised me the most was her Touches in the Attacking Penalty Box, which was 1.90 (83rd percentile). Added to this is was that Moriya is also very high in Take-On Attempts (1.96 per 90, 78th percentile), but low in Progressive Carries (0.82, 17th percntile). This seemed unusual to me, so I ran a linear regression to see how unusual.
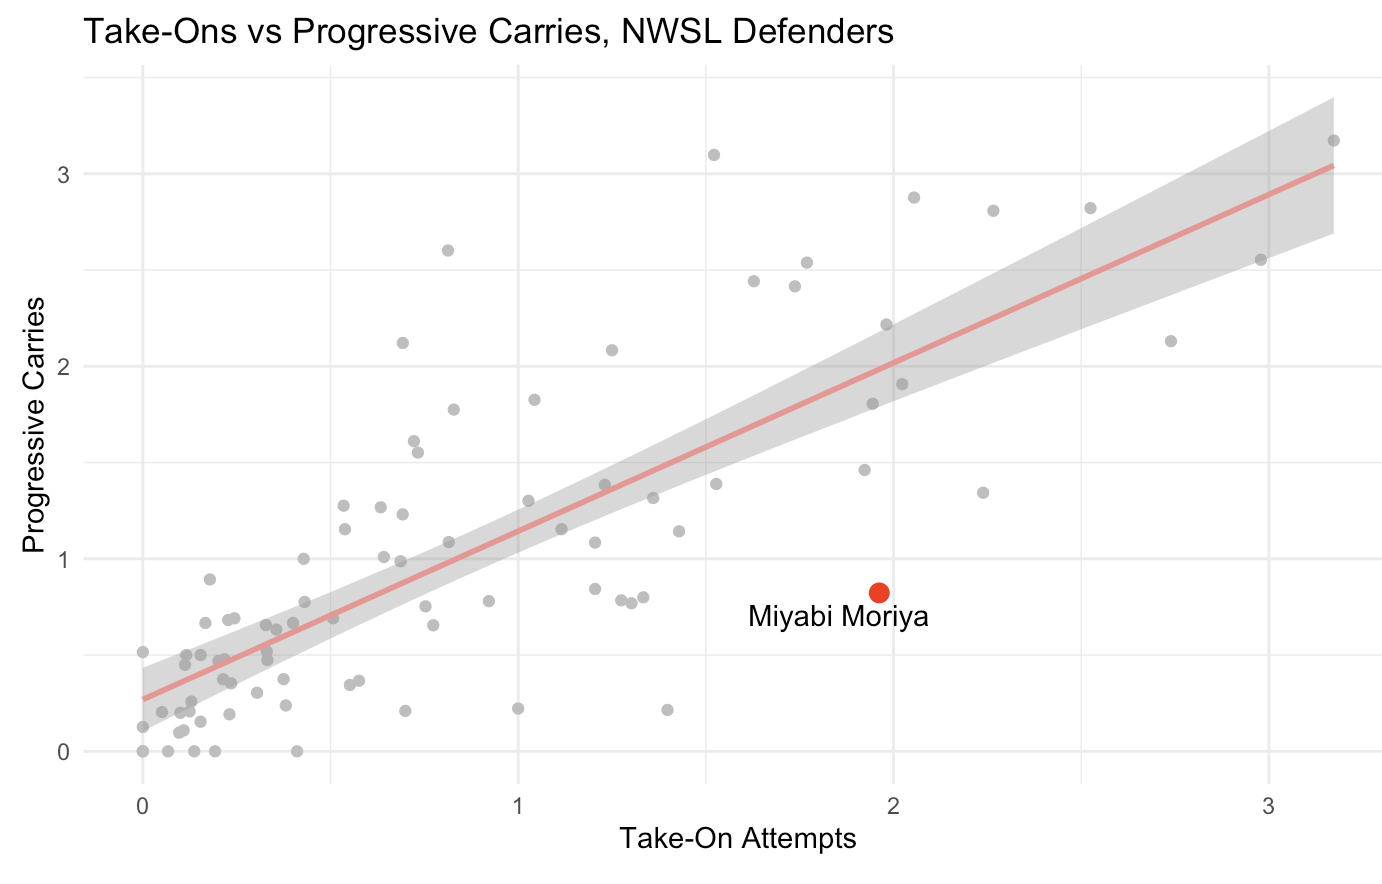
As we can see in the plot, there is a strong correlation here (coefficient = 0.87, R-squared = 0.629), but Moriya is a real outlier. This does line up in mind with what we saw in her passing chart. She’s generally not trying to carry the ball up the field. She plays more conservatively in her own half, but when she receives the ball higher up the field, she is willing to try to beat a defender. But this is probably a big reason why my k-means didn’t cluster her with the attacking fullbacks.
Conclusions
Moriya had signed a one year contract with Angel City, and therefore was a free agent at the end of the season. She signed a new deal with Utah at the start of the offseason. What is striking about this is that it was a salary-cap exempt deal. My understanding of this is that these types of deals can only be for the league minimum, have no bonuses except what the NWSL stipulates for every player, and expires on December 31st, at the latest, of the year in which the contract was signed. These types of contracts were primarly designed for short term, replacement players. If anyone knows more about this, please let me know. I couldn’t find that much information on this rule.
So first of all, I think that Moriya needs a new agent. She is a much better player than league-minimum. That, in my opinion, is for unproven college players, not 29 year olds with 12 caps for the 8th ranked team in the world. Second of all, I’m surprised that Angel City wasn’t interested in keeping her if it was for that low of deal. Perhaps she wanted a guarantee of minutes that ACFC wasn’t willing to provide, but she came in this year without being the clear cut choice and still had 13 starts. In my opinion, Moriya is an ideal #3 fullback. She doesn’t jump out to me in any particular area, but she’s not a defensive liability, she does contribute to the attack, and I think that she’s a decent passer. Maybe most importantly, she can play both right and left back. Even as a #3 fullback, I think that she would see a lot of playing time, and I think that if she had stayed, she would have been better in her second year.
Shores is a difficult player to categorize, and also one of the ACFC players whose stats I was most looking forward to breaking down. She joined Angel City midseason, after leaving the University of North Carolina, and played 7 games as a Left Back, 2 games as a midfielder, and the final three games as a centerback, albeit a leftsided centerback in a back three. So including her with the fullbacks made the most sense, although this range of positions may skew her stats somewhat. She has played as a midfielder in college and for the USWNT U-23s, however. In total, she played 983 minutes, and maybe most impressively, she started every single game she played in.
Passing and Playmaking
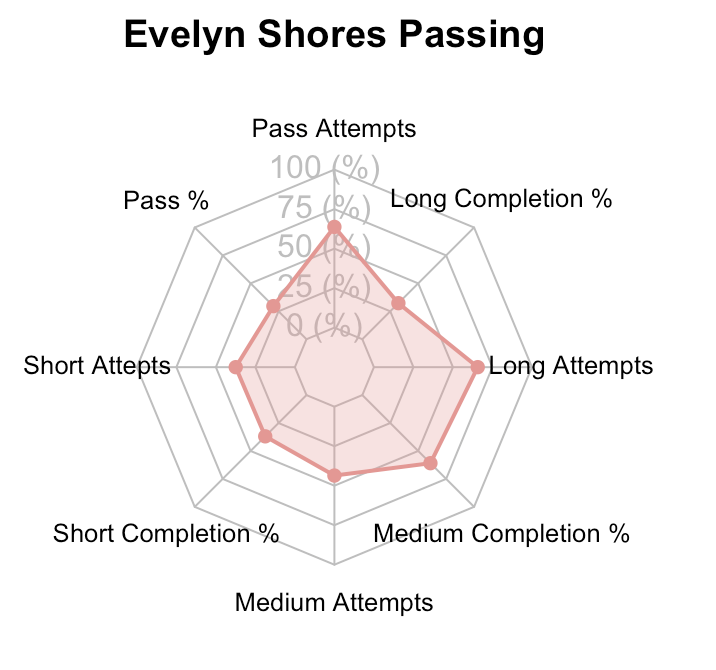
I wanted to include a seperate radar plot just of Shores’ Passing. It’s an interesting visual, as we see that Shores has a somewhat high number of overall attempts (47.79), but generally not a great Completion Percentage. The radar plot is in regards to all NWSL defenders, because of Shores playing both positions, but just compared to fullbacks, Shores is in the 29th, 42nd, 80th, and 10th percentile for Passing Completion Percentage for Overall, Short, Medium and Long Passing, respectively. Only Medium Passing really stands out here as being above average (and quite a bit above average). But Passing is undeniably a big part of Shores game, but this is skewed, actually by time at Centerback, even though that was only 3 games. Those 3 games had 3 of her 4 highest amounts of Pass Attempts, culminating in 117 Attempts in the home game vs KC Current. 41.95% of her Pass Attempts came in those 3 games. This is not to say that she was just passing it around in the back to build up those stats, either. In those three games, Shores had an average of 16.67 Long Passes, and accounted for almost half of her Long Passes for the season. Progressive Passes don’t include passes from within the defending 40% of the pitch, but even so, Shores had an average of 7 Progressive Passes per game, and 426.67 yards of Progressive Passing Distance. In her other 9 games as a leftback or midfielder, Shores had 5.89 Long Passes per game, 1.89 Progressive Passes per game, and 135.88 yards Progressive Passing Distance. This is a small, 3 game sample, but it puts Shores far above other centerbacks in these metrics when she played centerback, but far below other fullbacks when she played fullback. I talked about this during some of my game analyses, but while Shores wasn’t having great success with her Long Passing, it was clearly something that remained as part of the game plan. The coaching staff clearly wanted her to continue, even if the passes were not connecting.
One other note: the league leader in Long Pass Attempts was Hailie Mace, who had Temwa Chawinga to pass to. Shores only overlapped with Alyssa Thompson for 4 games. Nobody can stretch the field like Chawinga, but Alyssa Thompson is closer than most. Having a target that can consistently run in behind and latch onto those passes would have improved Shores’ Completion Percentage, but there just wasn’t anyone else like that on ACFC.
Shores’ xPass score from ASA was -5.58, and -1.07 per 100 minutes (37th out of 49 fullbacks, min 400 minutes). She had the 4th highest average distance per pass (22.45 yards), however, and the 7th highest average vertical distance (8.63 yards). For a rookie that didn’t even get to participate in preseason, I think that -5.58 is a not a bad score, especially for passes as challenging as Shores was attempting. Especially, adapting to two different roles (Left Back and Centerback) in which she hasn’t really been playing. The g+ on her passing was -0.18. Again, positive would be better, but this number isn’t as low as her completion percentage might have you believe.
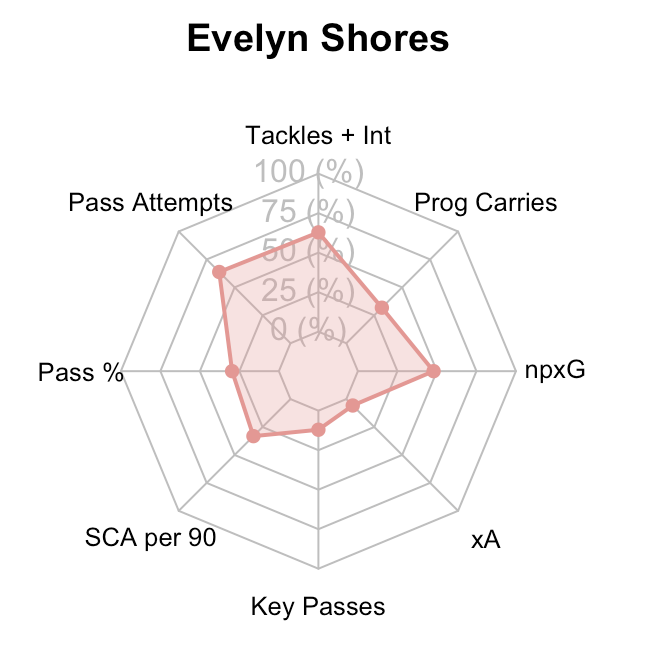
Regarding the playmaking side, this seems like the worst aspect of Shores’ radar plot. Her xAG (0.01 per 90), xA (0.02 per 90), and her Key Passes (0.27 per 90) are all in the 10th percentile or worse. She only had 3 Key Passes for the season. Shot Creating Actions aren’t much better (1.46 per 90, 24th percentile), but what is really interesting is that she has at least 1 SCA in every game except for the home win over Bay FC. What’s even more interesting is that despite consistently having one SCA in her games at fullback and midfield, it was at Centerback that she really took off. 7 of her 16 SCAs occurred in the three games at Centerback. While her overall SCA rate isn’t as high as Moriya or Thompson, it is higher than players I consider to be more comparable on the team, like Gorden, King, and Dourson, or Martin, Hodge, or Kennedy.
Goalscoring
I’m addressing this seperately, as on Shores’ fullback radar plot, NPxG stands out as a high point. her 0.08 NPxG is in the 83rd percentile of NWSL defenders. This is somewhat misleading, as more than half of these shots were the result of dead ball passes. Still, among ACFC fullbacks, centerbacks, and defensive midfielders, only Vignola had more Shots per 90 than Shores’ 1.19. Her 1 Goal came at home against the Spirit. This was one of the games in which she played as a midfielder, and while it came from a great pass from Thompson, Shores reads the play really well and has a perfectly timed run to arrive late in the box and get positioning over Croix Bethune for the shot. This was only one play, but it was a smart play, not a lucky one. Her g+ for shooting was 0.21, which was 5th among fullbacks (and two of those are actually forwards, Lussi and Dahlien). Shores was only .01 behind Gisele Thompson.
Defense
For someone that was mostly playing previously as a central midfielder, Shores was exceptionally good defensively, although the same caveat applies that Angel City may have invited so much opposition pressure that it inflates a defender’s defensive stats. Still, they look good, and as opposed to Moriya, it’s actually Interceptions in which Shores excels. She had 1.92 Interceptions per 90 (90th percentile), and 4.58 Tackles + Interceptions (87th percentile). Both were second on ACFC behind Hina Sugita. Because a fullback’s role necessitates providing width, I think that it’s harder to make Interceptions, so this impresses me even more. Tackles weren’t bad either: 2.66 Overall (73rd percentile), and 1.65 and 0.82 in the Defensive and Middle Thirds (both 78th percentile). She was making the challenges and getting to ball carriers, but her tackling technique does need to improve, as she had 0.92 Challenges Lost per 90 (20th percentile).
An aspect that I didn’t talk about with the other two players is Aerial Duels. This wasn’t a strength for either one, with Moriya successful 45.2% of the time, and Thompson at 25%. But it’s not really part of either of their games, as Thompson, in particular, only even attempts an Aerial Duel once every other game. I also don’t view this as something that is important for a fullback. However, this is part of Shores’ skillset. She is taller than the other fullbacks I discussed, listed at 5’9”, but even so, the middle of the pitch is usually the area to contest Aerial Duels, and Shores did spend most of her time playing wide. Despite this, she was 2nd on the team in Total Aerial Wins, behind Kennedy (It is something of a concern that none of Angel City’s top 3 in Aerial wins, Kennedy, Shores, and Hodge, played more than 60% of the available minutes). She was also 2nd on the team in Aerial Win Percentage (64.7%) behind Zelem. Compared to other NWSL fullbacks, Shores is in the 99th and 87th percentile of these categories.
Possession
Shores actually doesn’t particularly stand out in her Possession Stats. Her overall Touches (60.89) are just slightly above average (59th percentile). Again, unsurprisingly, the three games with the most Touches were all the games that she played at Centerback. And while Shores made more Progressive Passes than Thompson and Moriya, it is to be expected that she also has fewer Progressive Passes Received than the two of them (2.29 per 90 for Shores, 3.86 for Moriya and 5.16 for Thompson). What caught my eye, though, was that for their g+ model, ASA has Shores receiving the fourth most value (0.57) among fullbacks for receiving positions. So while she isn’t moving up the field as often, she is getting into, and occupying, good positions, at least according to ASA’s model.
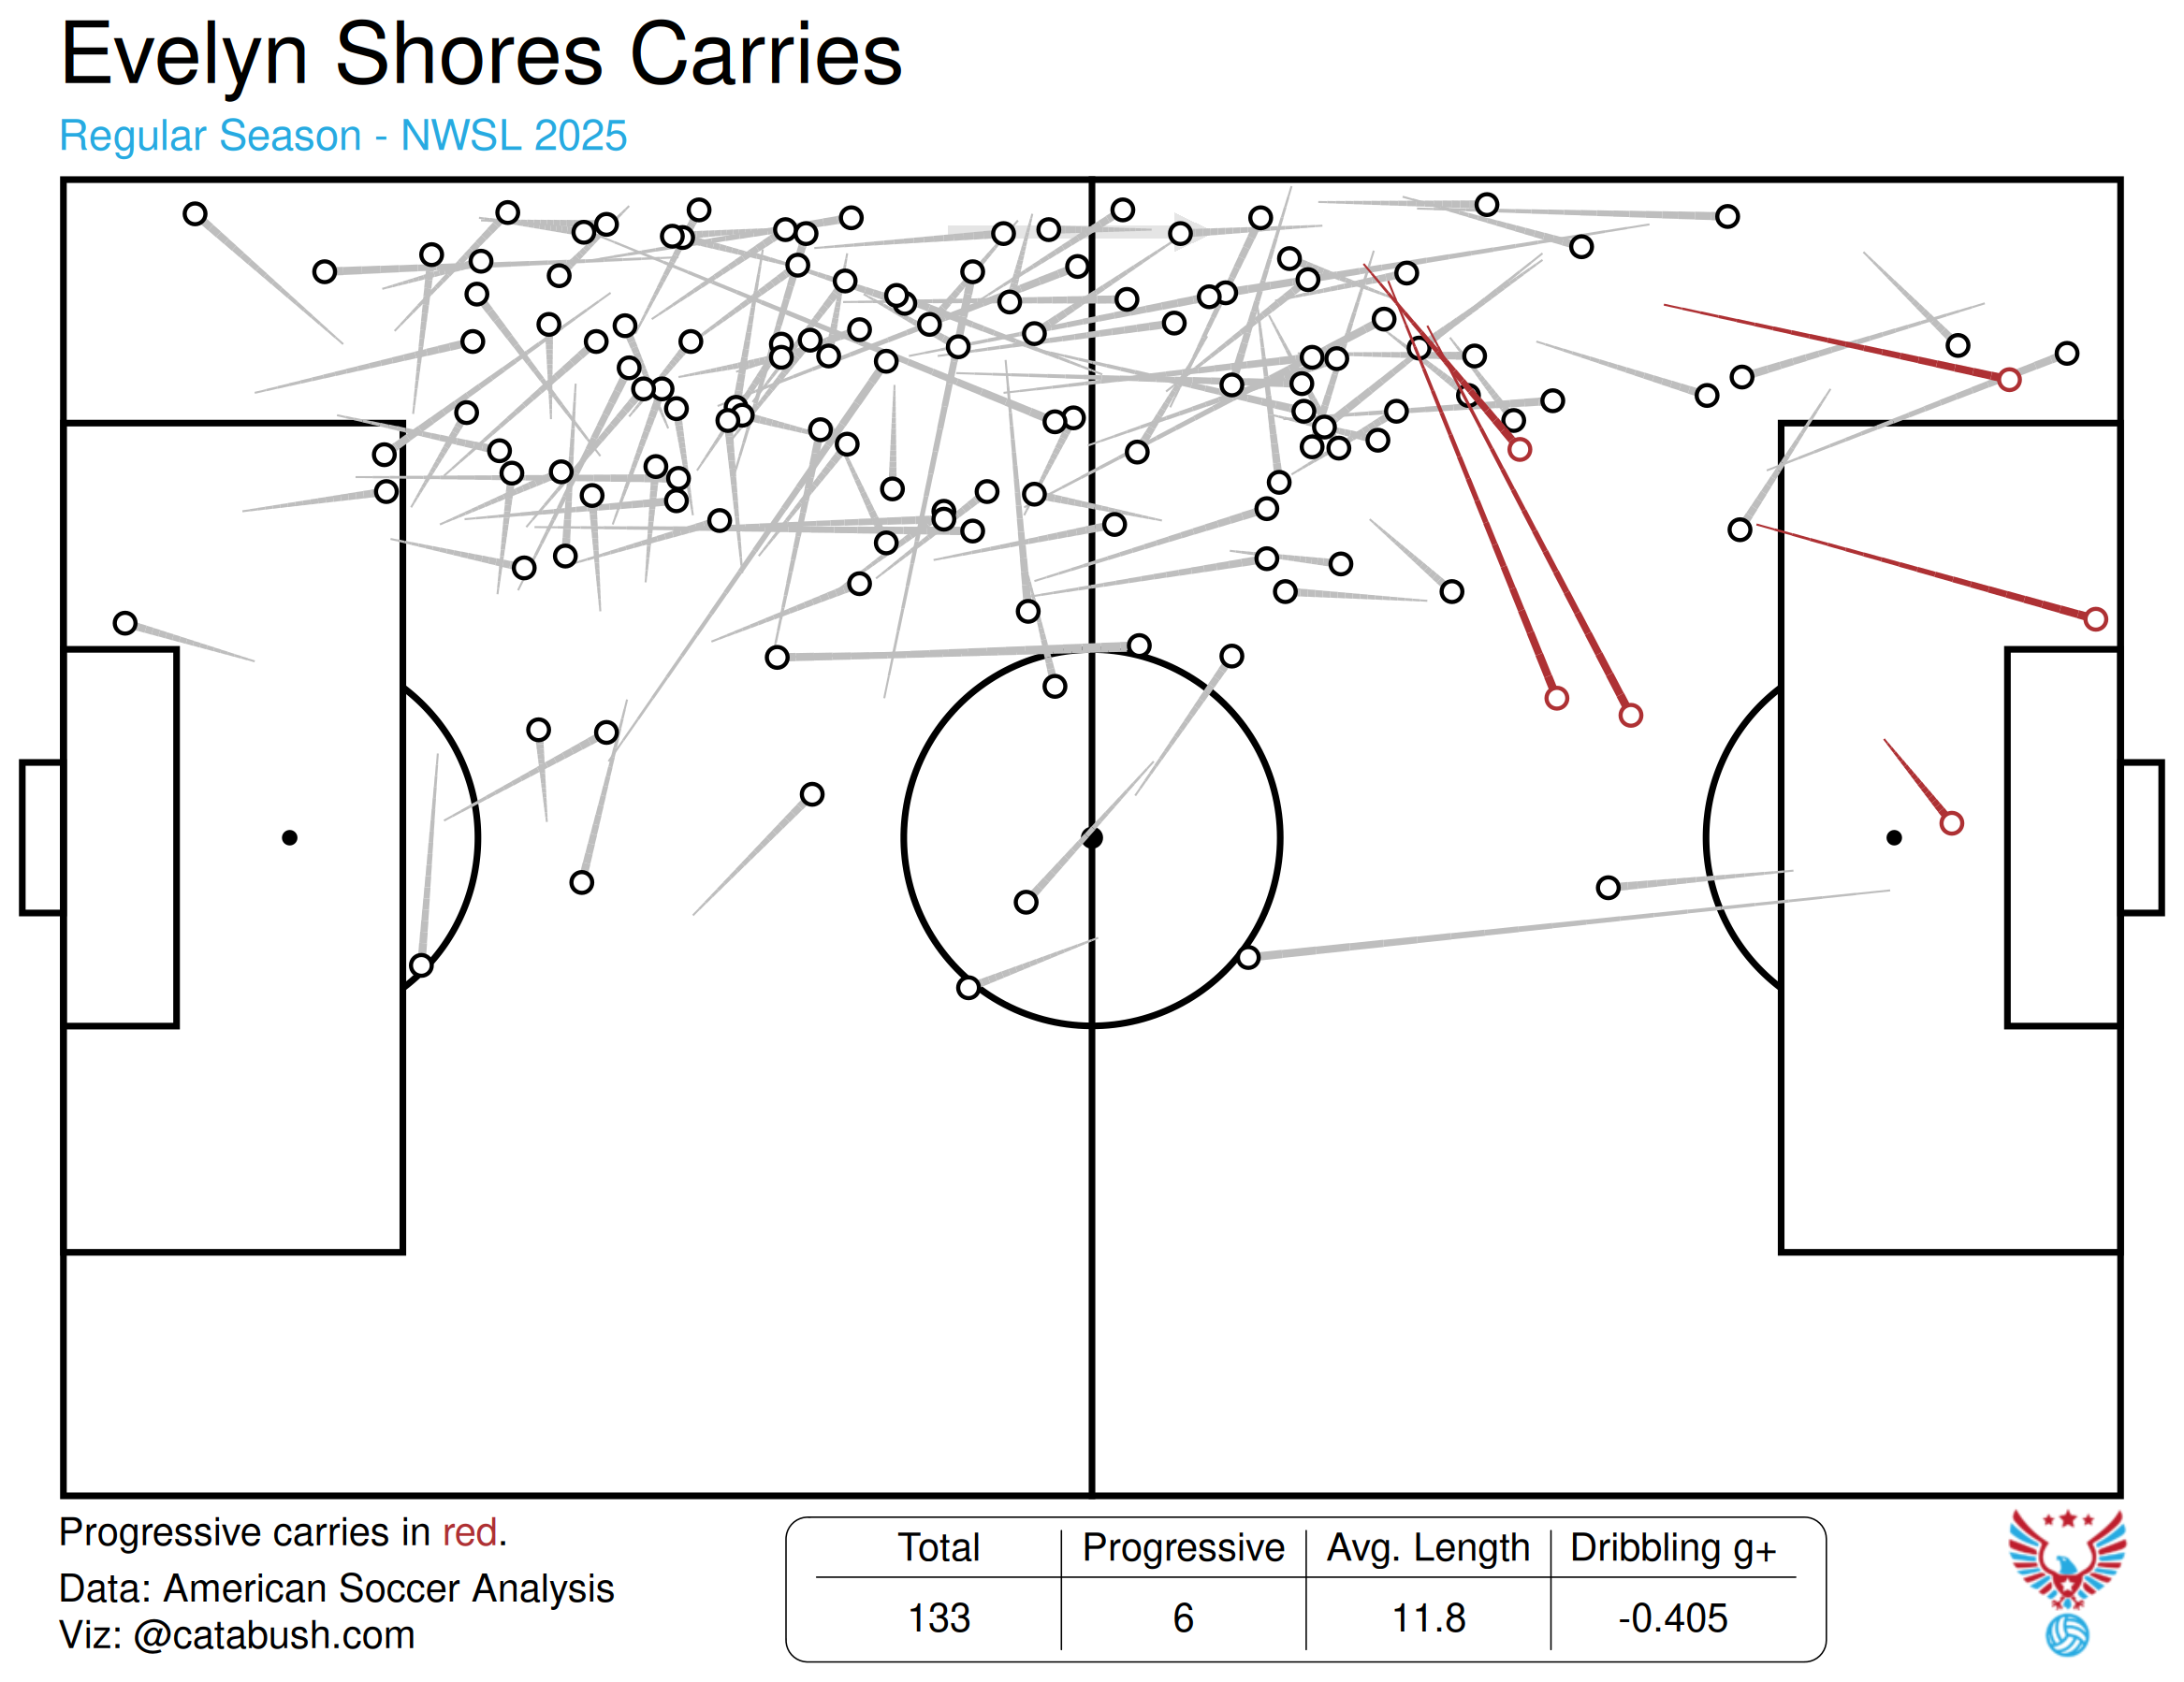
Dribbling and carries, however, were in the negative. Shores’ g+ score for dribbling was -0.44, the sixth worst score among defenders. She had more carries than I think I expected, with 29.48 per 90, more than Moriya or Thompson, though her average carry distance (5.40 yards) was shorter than Thompson’s, but longer than Moriya’s. Shores was only averaging 1.01 Progressive Carries per game, which is 3.42% of her Total Carries (24th percentile). However, she did make the most of the limited chances, with 80.57 Progressive Yards, though this is probably likely due to Progressive Carries not being scored as such if they end in the defending half of the pitch. We can see in the plot below that there are many carries that move the ball up field, but still end within ACFC’s half. Shores rarely attempted Take-Ons (0.64, 15th percentile), and correspondingly had very few Successful Take -Ons (0.27, 17th percentile). Her 42.9% success rate (49th percentile) is part of what brings down her g+ dribbling score, I think.
Conclusion
I thought that Shores did well overall. I think that she demonstrates really good positioning instincts, based on her interception rate and receiving scores. She has good vision and passing range, but probably needs to polish her passing just a little bit more. The real problem is what position will Shores play in 2026? To me, she looked best at Central Midfield, even though that was just two games, and I think her skill set reflects that. If I were a scout, I would say that she could be in the mold of a Sam Coffey. I actually compared Coffey’s stats from her rookie season with Shores, and while Coffey was the better passer by a significant margin, she was also playing with better teammates, and I think that a number of other metrics are similar. However, Angel City now has three veteran central midfielders (Sugita, Martin, and Borges), and also signed two more college players that play in the midfield. But as they’ve let Moriya leave, and traded away Vignola, there is currently nobody else to play Left Back, as far as I can tell. If Strauss keeps playing three centerbacks, that also now seems likely to be King, Sams, and Gorden. I think that Shores has tremendous potential, and she only has half a season of professional experience. But I’m not sure where she will fit into the team in 2026. Of course, there is still the possibility of more moves, but the two Left Backs that were available and that I would have liked to see join Angel City (Nighswonger or Pickett) both went to other teams.
Players Not Discussed
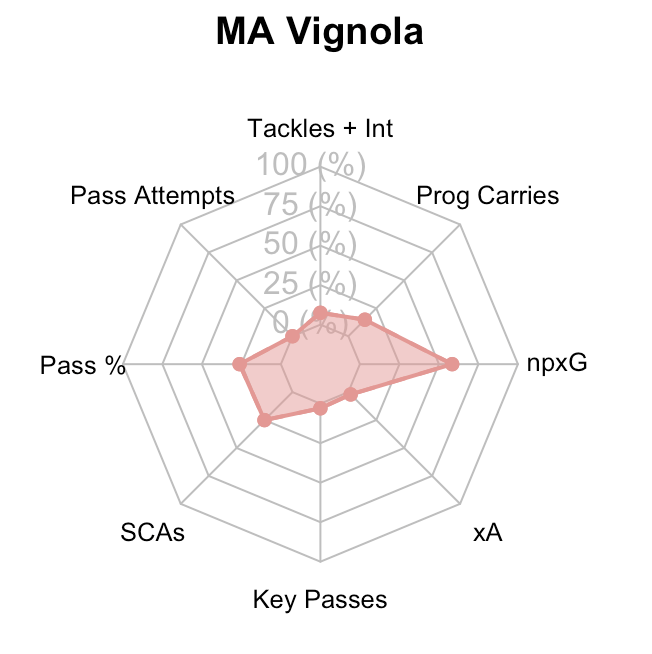
I’m including Vignola’s radar plot, since it was easy enough to create, but as I said at the top, I’m not going to do a full analysis for players that left or were traded during the season. Still, that radar plot doesn’t look as good as we might have expected. Maybe the biggest surprise from my clustering was that the computer did not consider Vignola to be an attacking fullback, but that makes more sense looking at this plot. I always liked Vignola, though, and not just because we share a birthday. After her campaign in 2023, I had really high hopes that she would become truly elite, marauding up and down the left. Some of that was derailed by injury last year, but this year she seemed pretty healthy, with 16 starts from 20 appearances. But she never managed to get back to that same level from 2023, in my opinion, let alone surpass it. I feel like she could be a 3 G-5A fullback that can also defend against any winger in the league. And she hasn’t been bad, but seemed to stall on that trajectory towards being elite. I hope that the move to Portland works out for her, and wish her the best. I think that the trade for Sugita was truly a win/win for both teams.
Hannah Johnson
Johnson played in 1 match, for 29 minutes. She was on a short term deal that has expired and has not been re-signed.
Sophia Mattice
Mattice played in 3 matches, all coming off the bench, for a total of 27 minutes. Mattice is under contract for one more year. She’s still only 24, so possibly she may grow into a larger role next season.
Ali Riley
Club legend. She made two appearances for a total of 10 minutes. Retires at the end of an exceptional career.
Elizabeth Eddy
0 appearances for 0 minutes. Made no contributions on or off the field. Her contract expired at the end of the season and was not renewed.
All stats are from FB Ref and American Soccer Analysis. Visualizations are by me, unless identified as ASA’s.